+ - 0:00:00
Notes for current slide
Notes for next slide

量化金融与金融编程

L02 ggplot2 数据可视化 | 课前预习


曾永艺

厦门大学管理学院


2023-09-18

1 / 36

一图胜千言

3 / 36

ggplot2v3.4.3 快速入门

4 / 36

1 The Layered Grammar of Graphics

Data Visualization:将数据映射为几何对象的美学属性

5 / 36

1 The Layered Grammar of Graphics

Data Visualization:将数据映射为几何对象的美学属性

  • 数据(data):我们想要可视化的对象,包含变量
  • 几何对象(geometries):用来呈现数据的几何图形对象,如点、条形、线条等
  • 美学属性(aesthetic):几何对象的视觉属性,如x坐标和y坐标位置、颜色、形状等
5 / 36

1 The Layered Grammar of Graphics

Data Visualization:将数据映射为几何对象的美学属性

  • 数据(data):我们想要可视化的对象,包含变量
  • 几何对象(geometries):用来呈现数据的几何图形对象,如点、条形、线条等
  • 美学属性(aesthetic):几何对象的视觉属性,如x坐标和y坐标位置、颜色、形状等

5 / 36

1 The Layered Grammar of Graphics

ggplot2 的语法模板

6 / 36

1 The Layered Grammar of Graphics

ggplot2 的语法模板

ggplot(data = <DATA>) +
<GEOM_FUNCTION>(
mapping = aes(<MAPPINGS>),
stat = <STAT>,
position = <POSITION>
) +
<COORDINATE_FUNCTION> +
<FACET_FUNCTION>
6 / 36

2 将数据映射为几何对象的美学属性

library(tidyverse)
7 / 36

2 将数据映射为几何对象的美学属性

library(tidyverse)
mpg # print(mpg)
#> # A tibble: 234 × 11
#> manufacturer model displ year cyl trans drv cty hwy fl class
#> <chr> <chr> <dbl> <int> <int> <chr> <chr> <int> <int> <chr> <chr>
#> 1 audi a4 1.8 1999 4 auto(l5) f 18 29 p compact
#> 2 audi a4 1.8 1999 4 manual(m5) f 21 29 p compact
#> 3 audi a4 2 2008 4 manual(m6) f 20 31 p compact
#> # ℹ 231 more rows
# 查看ggplot2包内置数据集mpg的帮助文档
?mpg # help(mpg)
  1. displ: a car's engine size, in litres.
  2. hwy: a car's fuel efficiency on the highway, in miles per gallon (mpg).
  3. class: "type" of car
    ...
7 / 36

2 将数据映射为几何对象的美学属性

ggplot()

7 / 36

2 将数据映射为几何对象的美学属性

ggplot(data = mpg) # 数据集

7 / 36

2 将数据映射为几何对象的美学属性

ggplot(data = mpg, # 数据集
mapping = aes(x = displ, y = hwy)) # 映射:变量 -> x坐标和y坐标

7 / 36

2 将数据映射为几何对象的美学属性

ggplot(data = mpg, # 数据集
mapping = aes(x = displ, y = hwy)) + # 映射:变量 -> x坐标和y坐标
geom_point() # 几何对象

7 / 36

2 将数据映射为几何对象的美学属性

ggplot(data = mpg) +
geom_point(
mapping = aes(x = displ, y = hwy, colour = class) # 3个映射
)

8 / 36

2 将数据映射为几何对象的美学属性

ggplot(data = mpg) +
geom_point(mapping = aes(x = displ, y = hwy, shape = class))
#> Warning: The shape palette can deal with a maximum of 6 discrete values because more than
#> 6 becomes difficult to discriminate; you have 7. Consider specifying shapes
#> manually if you must have them.
#> Warning: Removed 62 rows containing missing values (`geom_point()`).
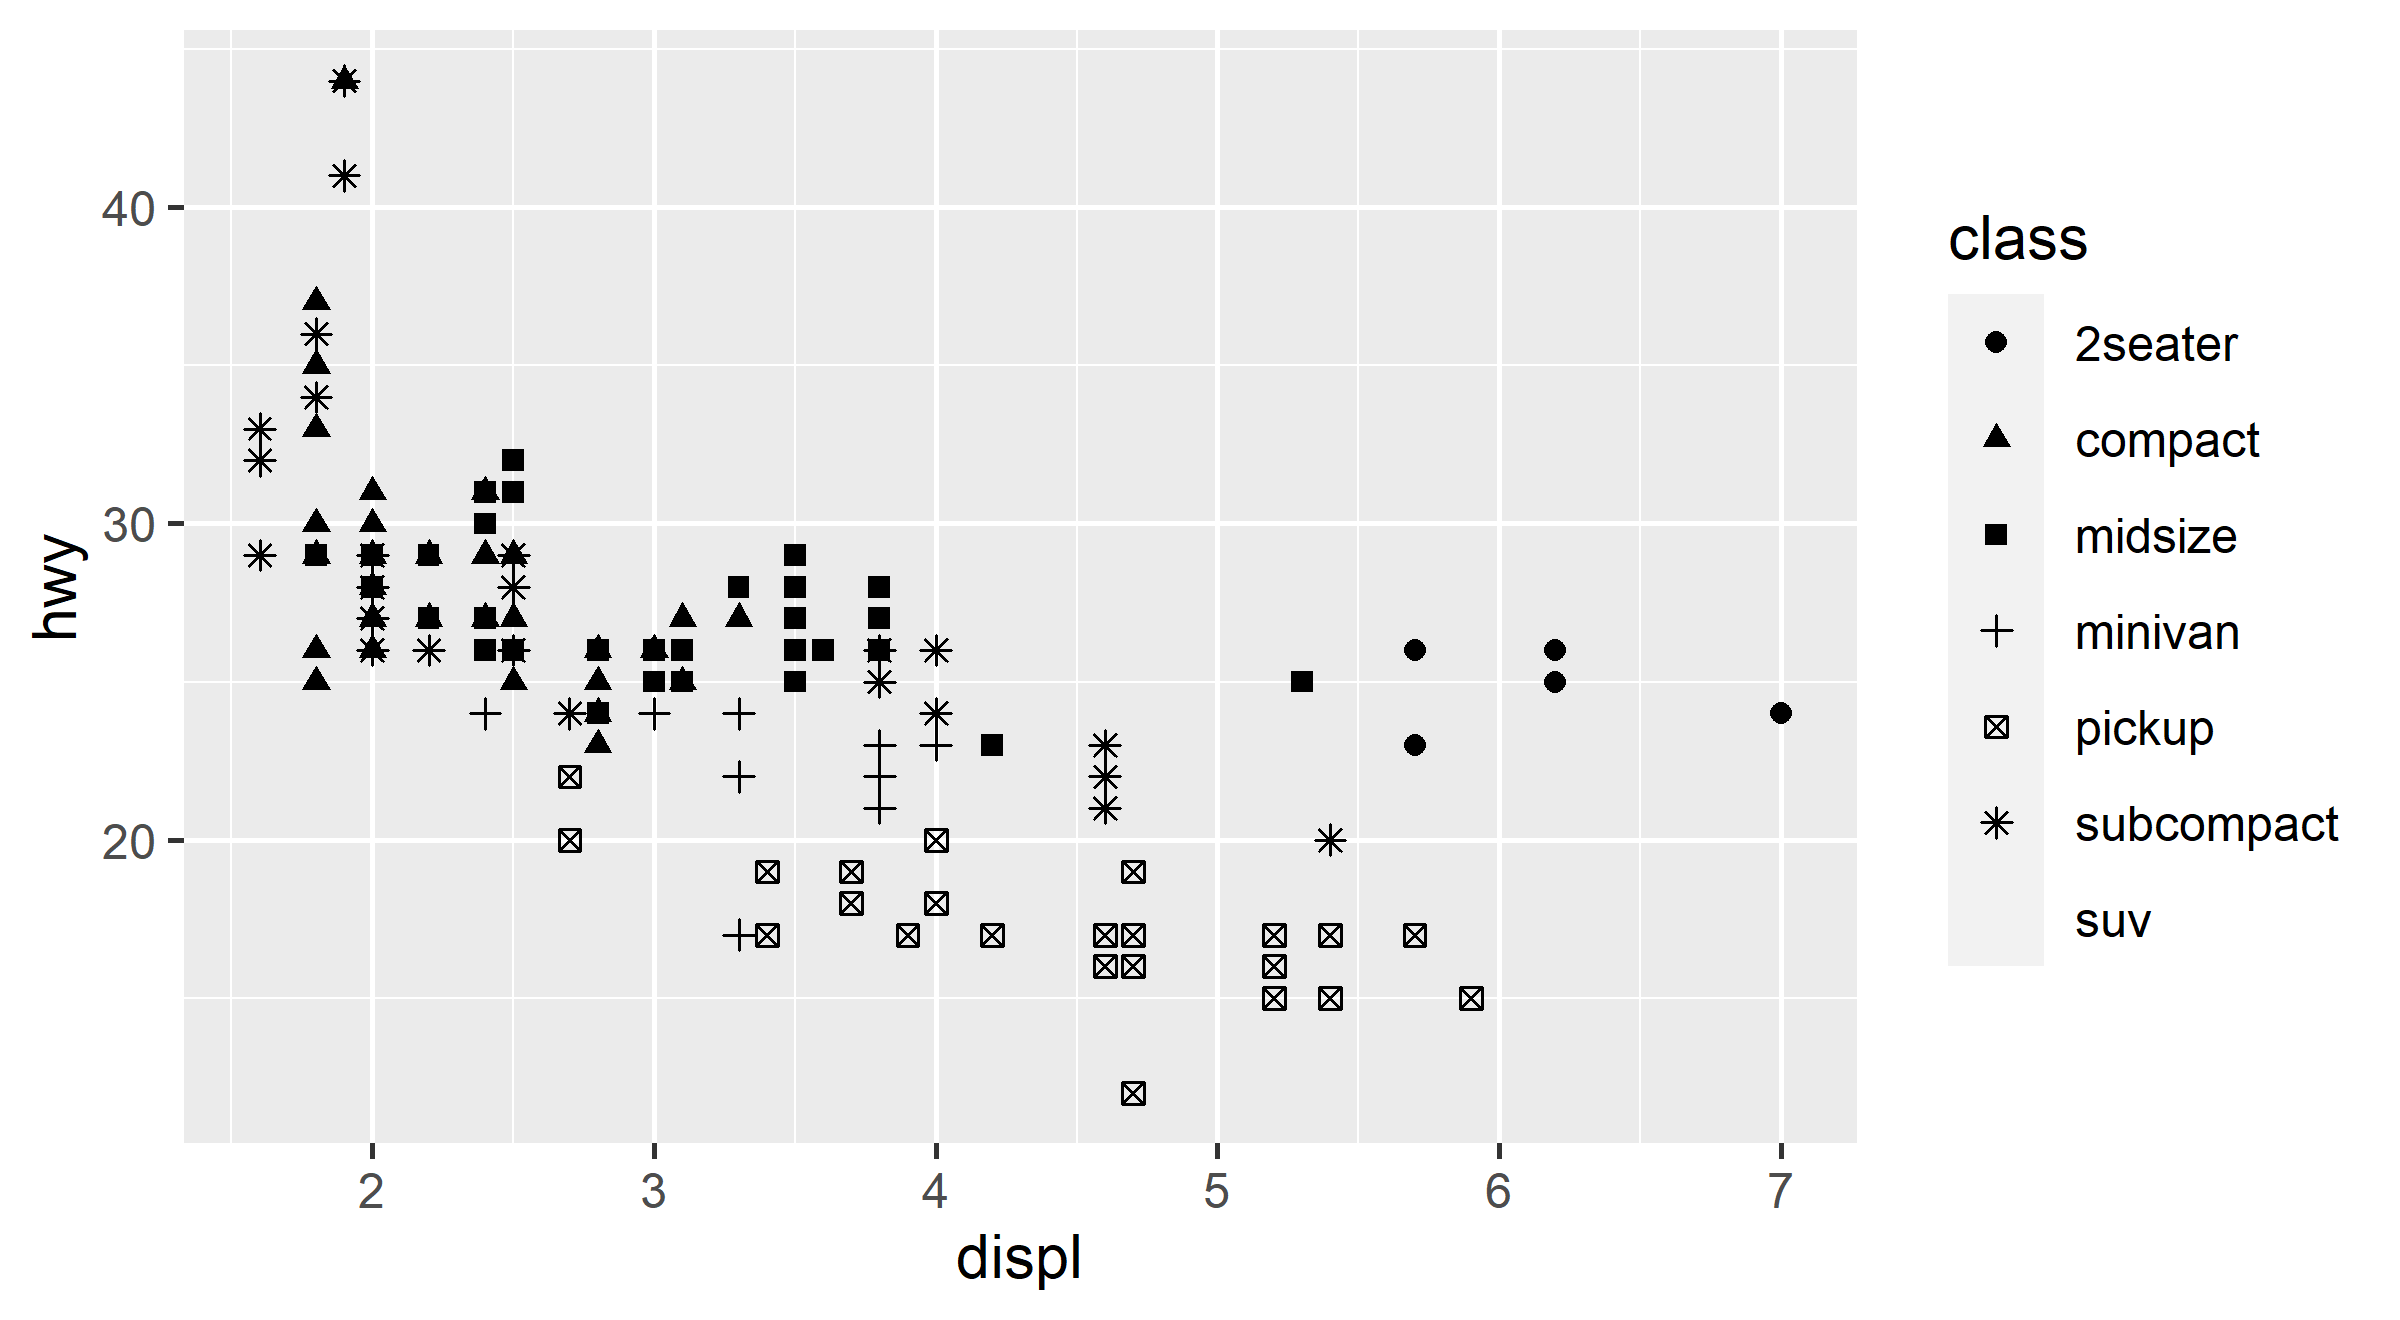
9 / 36

2 将数据映射为几何对象的美学属性

  • R内置有25个形状(shape),在ggplot2中可用名字或数字进行设定

10 / 36

2 将数据映射为几何对象的美学属性

  • R内置有25个形状(shape),在ggplot2中可用名字或数字进行设定

10 / 36

2 将数据映射为几何对象的美学属性

  • R内置有25个形状(shape),在ggplot2中可用名字或数字进行设定

  • 设定图形属性相关的说明文档 vignette("ggplot2-specs")
10 / 36

2 将数据映射为几何对象的美学属性

ggplot(data = mpg) +
geom_point(
mapping = aes(x = displ, y = hwy),
shape = "triangle", size = 3, colour = "red", alpha = 0.3
# 变量无关(“大家都一样”,即非映射)的几何对象图形属性应在aes()外进行设定
)

11 / 36

2 将数据映射为几何对象的美学属性

# layered!
ggplot(data = mpg) +
geom_point(mapping = aes(x = displ, y = hwy)) +
geom_smooth(mapping = aes(x = displ, y = hwy)) # layered!

12 / 36

2 将数据映射为几何对象的美学属性

ggplot(
data = mpg,
mapping = aes(x = displ, y = hwy) # 共用映射,提前至ggplot()中
) +
geom_point() +
geom_smooth()

13 / 36

2 将数据映射为几何对象的美学属性

ggplot(mpg, aes(displ, hwy)) + # 省略常用参数名
geom_point(aes(colour = class)) + # 图层自用映射
geom_smooth(data = filter(mpg, class == "pickup")) # 不同的数据集

14 / 36

3 统计变换、位置调整、坐标、分面

ggplot(data = diamonds) +
geom_bar(mapping = aes(x = cut))
15 / 36

3 统计变换、位置调整、坐标、分面

ggplot(data = diamonds) +
geom_bar(mapping = aes(x = cut))

Where comes the "count" in y-axis? 😅

15 / 36

3 统计变换、位置调整、坐标、分面

16 / 36

3 统计变换、位置调整、坐标、分面

下面的代码会得到和使用 geom_bar() 相同的结果

ggplot(data = diamonds) +
stat_count(mapping = aes(x = cut))
16 / 36

3 统计变换、位置调整、坐标、分面

ggplot(data = diamonds) +
geom_bar(mapping = aes(x = cut,
y = after_stat(prop), # ?aes_eval
group = 1)) # ?aes_group_order

17 / 36

3 统计变换、位置调整、坐标、分面

ggplot(data = diamonds %>% group_by(cut) %>% count()) + # 数据分组汇总计算
geom_bar(
mapping = aes(x = cut, y = n),
stat = "identity"
)

18 / 36

3 统计变换、位置调整、坐标、分面

ggplot(data = diamonds) +
geom_bar(mapping = aes(x = cut, fill = clarity))
# geom_bar()默认的position = "stack"

19 / 36

3 统计变换、位置调整、坐标、分面

ggplot(data = diamonds) +
geom_bar(
mapping = aes(x = cut, fill = clarity),
position = "dodge" # position = position_dodge(width = 0.9)
)

20 / 36

3 统计变换、位置调整、坐标、分面

ggplot(data = mpg) +
geom_point(
mapping = aes(x = displ, y = hwy),
position = "jitter" # same as `ggplot() + geom_jitter()`
)

21 / 36

3 统计变换、位置调整、坐标、分面

ggplot(data = mpg, mapping = aes(x = class, y = hwy)) +
geom_boxplot() +
coord_flip() # ggplot2 3.3.0后直接调换x,y参数即可

22 / 36

3 统计变换、位置调整、坐标、分面

bar <- ggplot(data = diamonds) + # 将图形对象存为变量bar,可在Environment标签页中检查其内容
geom_bar(
mapping = aes(x = cut, fill = cut), show.legend = FALSE, width = 1
) +
theme(aspect.ratio = 1) + labs(x = NULL, y = NULL)
bar + coord_polar()

23 / 36

3 统计变换、位置调整、坐标、分面

ggplot(data = mpg, mapping = aes(x = displ, y = hwy)) +
geom_point(data = mutate(mpg, class = NULL), colour = "grey") +
geom_point() +
facet_wrap(vars(class), nrow = 2) # facet_wrap(~ class, nrow = 2)

24 / 36

3 统计变换、位置调整、坐标、分面

ggplot(data = mpg, mapping = aes(x = displ, y = hwy)) +
geom_point(data = transform(mpg, cyl = NULL), colour = "grey") +
geom_point() +
facet_grid(rows = vars(drv), cols = vars(cyl)) # facet_grid(drv ~ cyl)

25 / 36

4 标签、标注、标度、主题等

ggplot(mpg, aes(displ, hwy)) +
geom_point(aes(colour = class)) +
geom_smooth(se = FALSE) +
labs( # 标题、小标题等
title = "Fuel efficiency",
subtitle = "... generally decreases with engine size",
caption = "Data from fueleconomy.gov"
)

26 / 36

4 标签、标注、标度、主题等

ggplot(mpg, aes(displ, hwy)) +
geom_point(aes(colour = class)) +
geom_smooth(se = FALSE) +
labs( # 图形属性 = 标签
x = "Engine displacement (L)",
y = "Highway fuel economy (mpg)",
colour = "Car type"
)

27 / 36

4 标签、标注、标度、主题等

# 生成辅助数据集
best <- mpg %>%
group_by(class) %>%
filter(row_number(desc(hwy)) == 1)
28 / 36

4 标签、标注、标度、主题等

# 生成辅助数据集
best <- mpg %>%
group_by(class) %>%
filter(row_number(desc(hwy)) == 1)
ggplot(mpg, aes(displ, hwy)) +
geom_point(aes(colour = class)) +
geom_text(
aes(label = model),
data = best
)
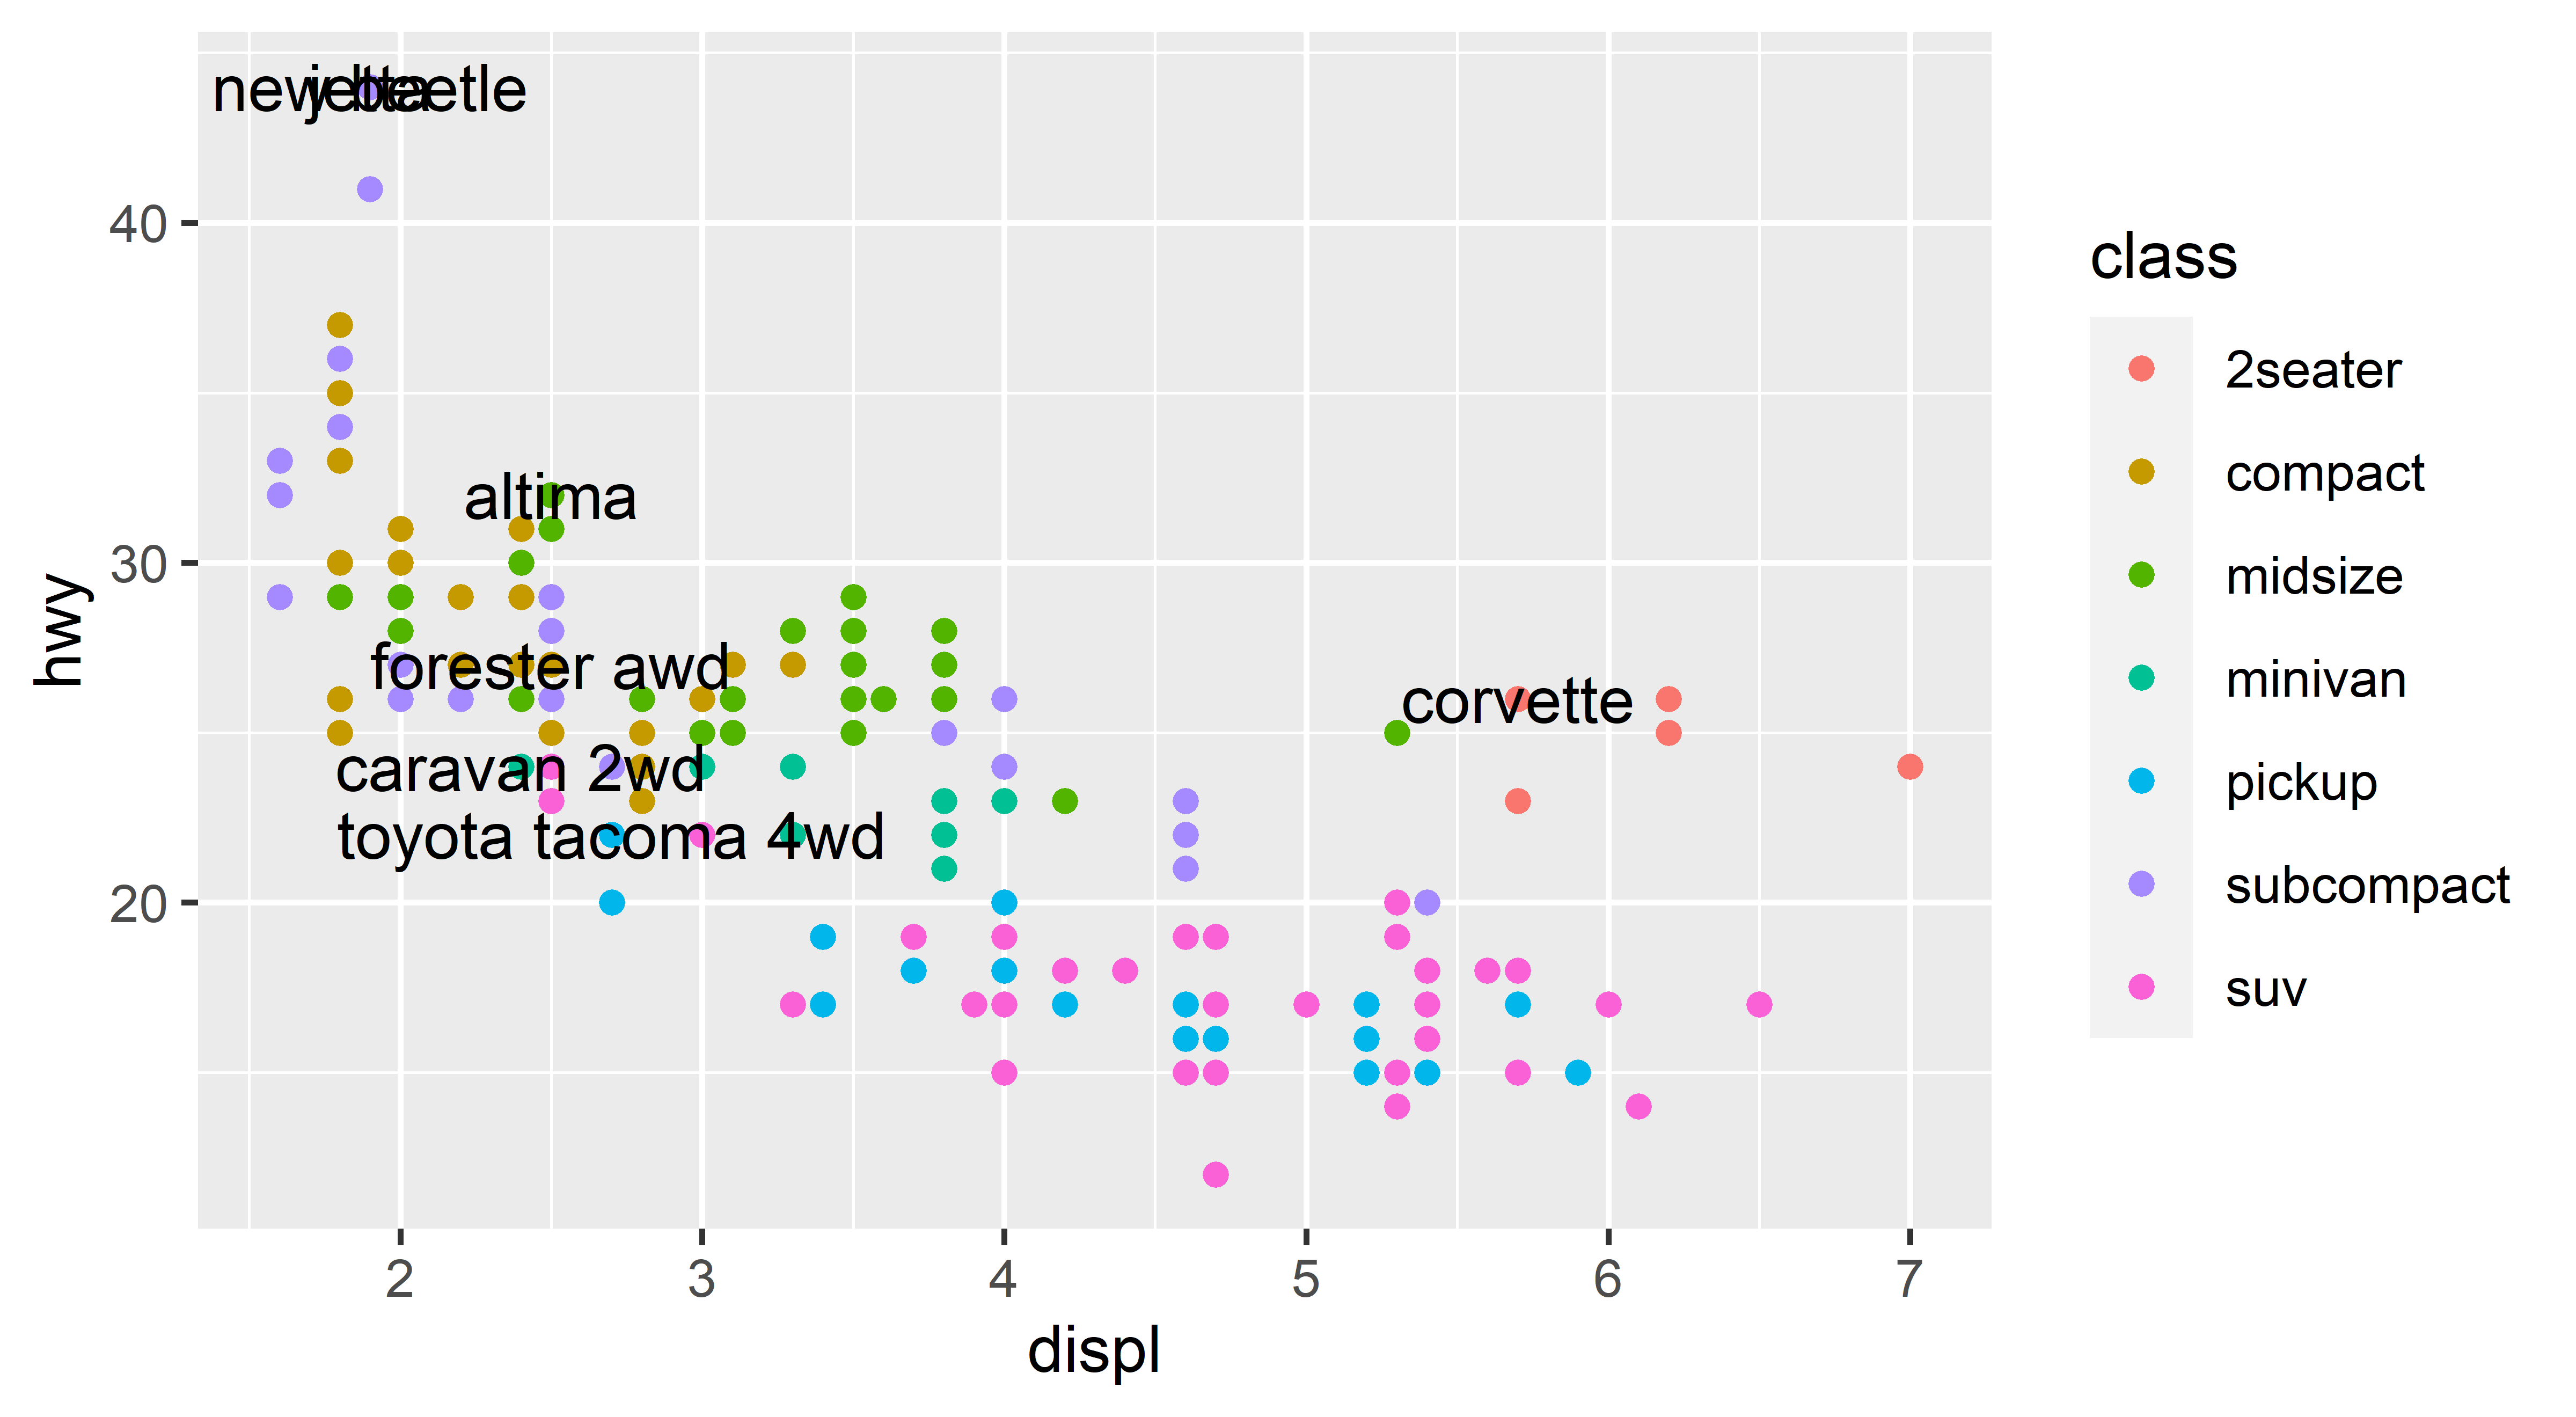
28 / 36

4 标签、标注、标度、主题等

# 生成辅助数据集
best <- mpg %>%
group_by(class) %>%
filter(row_number(desc(hwy)) == 1)
ggplot(mpg, aes(displ, hwy)) +
geom_point(aes(colour = class)) +
geom_text(
aes(label = model),
data = best
)

ggplot(mpg, aes(displ, hwy)) +
geom_point(aes(colour = class)) +
geom_label(
aes(label = model), data = best,
nudge_y = 2, alpha = 0.5
)
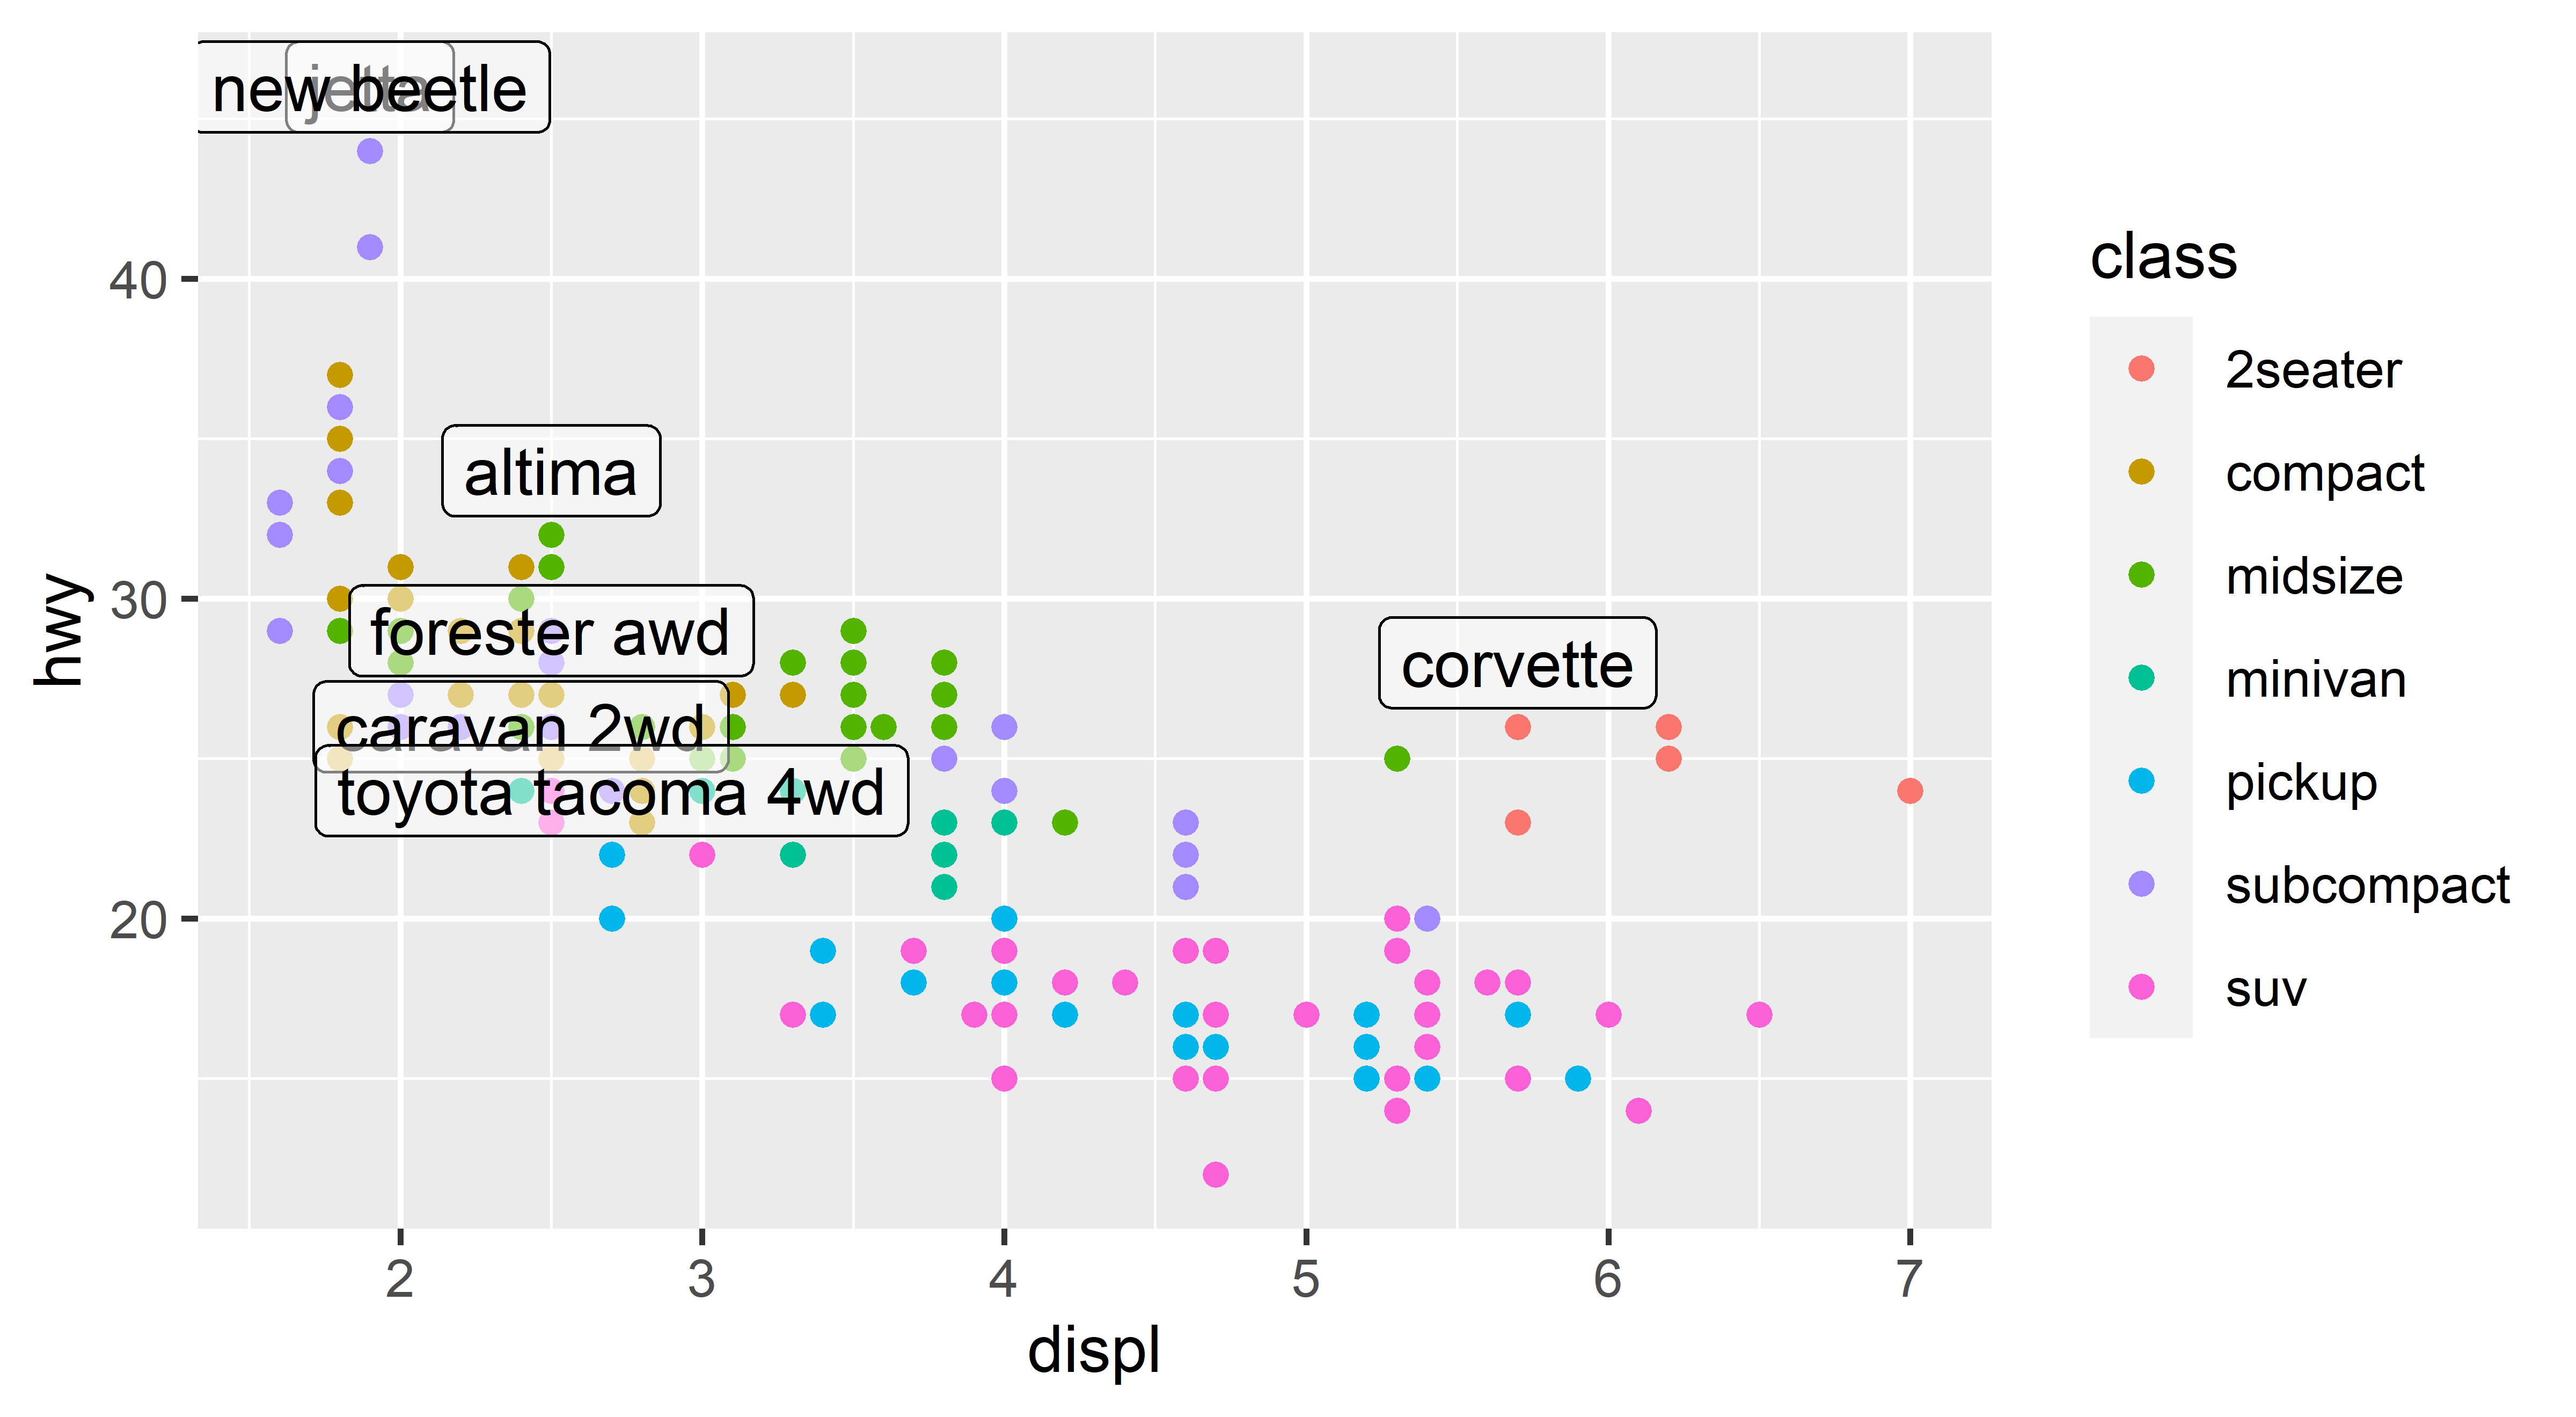
28 / 36

4 标签、标注、标度、主题等

ggplot(mpg, aes(displ, hwy)) +
geom_point(aes(colour = class)) +
geom_point(size = 3, shape = 1, data = best) +
ggrepel::geom_label_repel(aes(label = model), data = best) # install ggrepel

29 / 36

4 标签、标注、标度、主题等

ggplot(diamonds, aes(carat, price)) +
geom_bin2d() +
scale_x_log10() +
scale_y_log10()

30 / 36

4 标签、标注、标度、主题等

ggplot(mpg, aes(displ, hwy)) +
geom_point() +
scale_y_continuous(
name = "Highway fuel economy (mpg)",
breaks = seq(0, 50, by = 10),
limits = c(0, 50)
)

31 / 36

4 标签、标注、标度、主题等

ggplot(mpg, aes(displ, hwy)) +
geom_point(aes(colour = drv, shape = drv)) +
scale_colour_brewer(palette = "Set1") # RColorBrewer::display.brewer.all()

32 / 36

4 标签、标注、标度、主题等

ggplot(mpg, aes(displ, hwy, colour = class)) +
geom_point() +
theme(legend.position = "bottom") +
guides(
colour = guide_legend(nrow = 1, override.aes = list(size = 3))
)

33 / 36

4 标签、标注、标度、主题

ggplot(mpg, aes(displ, hwy)) +
geom_point(aes(colour = class)) +
geom_smooth(se = FALSE) +
theme_minimal()

34 / 36

4 标签、标注、标度、主题

ggplot(mpg, aes(displ, hwy)) +
geom_point(aes(colour = class)) +
geom_smooth(se = FALSE) +
theme_minimal()

ggplot(mpg, aes(displ, hwy)) +
geom_point(aes(colour = class)) +
geom_smooth(se = FALSE) +
ggthemes::theme_stata() # install it!

34 / 36

4 标签、标注、标度、主题

theme(line, rect, text, title, aspect.ratio, axis.title, axis.title.x,
axis.title.x.top, axis.title.x.bottom, axis.title.y, axis.title.y.left,
axis.title.y.right, axis.text, axis.text.x, axis.text.x.top,
axis.text.x.bottom, axis.text.y, axis.text.y.left, axis.text.y.right,
axis.ticks, axis.ticks.x, axis.ticks.x.top, axis.ticks.x.bottom, axis.ticks.y,
axis.ticks.y.left, axis.ticks.y.right, axis.ticks.length, axis.ticks.length.x,
axis.ticks.length.x.top, axis.ticks.length.x.bottom, axis.ticks.length.y,
axis.ticks.length.y.left, axis.ticks.length.y.right, axis.line, axis.line.x,
axis.line.x.top, axis.line.x.bottom, axis.line.y, axis.line.y.left,
axis.line.y.right, legend.background, legend.margin, legend.spacing,
legend.spacing.x, legend.spacing.y, legend.key, legend.key.size,
legend.key.height, legend.key.width, legend.text, legend.text.align,
legend.title, legend.title.align, legend.position, legend.direction,
legend.justification, legend.box, legend.box.just, legend.box.margin,
legend.box.background, legend.box.spacing, panel.background, panel.border,
panel.spacing, panel.spacing.x, panel.spacing.y, panel.grid, panel.grid.major,
panel.grid.minor, panel.grid.major.x, panel.grid.major.y, panel.grid.minor.x,
panel.grid.minor.y, panel.ontop, plot.background, plot.title,
plot.title.position, plot.subtitle, plot.caption, plot.caption.position,
plot.tag, plot.tag.position, plot.margin, strip.background, strip.background.x,
strip.background.y, strip.clip, strip.placement, strip.text, strip.text.x,
strip.text.x.bottom, strip.text.x.top, strip.text.y, strip.text.y.left,
strip.text.y.right, strip.switch.pad.grid, strip.switch.pad.wrap, ...,
complete = FALSE, validate = TRUE)
35 / 36


本网页版讲义的制作由 R 包 {{xaringan}} 赋能!
36 / 36
Paused

Help

Keyboard shortcuts

, , Pg Up, k Go to previous slide
, , Pg Dn, Space, j Go to next slide
Home Go to first slide
End Go to last slide
Number + Return Go to specific slide
b / m / f Toggle blackout / mirrored / fullscreen mode
c Clone slideshow
p Toggle presenter mode
t Restart the presentation timer
?, h Toggle this help
oTile View: Overview of Slides
Esc Back to slideshow