量化金融与金融编程
L4 dplyr1.1.3 数据处理
曾永艺
厦门大学管理学院
2023-10-13
A Grammar of
Data Manipulation
A Grammar of
Data Manipulation
样本处理
变量处理
汇总
分组和行式处理
用
%>%连接多个操作合并多个数据集
操作数据库和
data.table
library(tidyverse)library(nycflights13)data(package = "nycflights13")# 包含airlines、airports、flights、planes、weather等5个数据集flights # just print() it#> # A tibble: 336,776 × 19#> year month day dep_time sched_dep_time dep_delay arr_time sched_arr_time arr_delay#> <int> <int> <int> <int> <int> <dbl> <int> <int> <dbl>#> 1 2013 1 1 517 515 2 830 819 11#> 2 2013 1 1 533 529 4 850 830 20#> 3 2013 1 1 542 540 2 923 850 33#> # ℹ 336,773 more rows#> # ℹ 10 more variables: carrier <chr>, flight <int>, tailnum <chr>, origin <chr>,#> # dest <chr>, air_time <dbl>, distance <dbl>, hour <dbl>, minute <dbl>,#> # time_hour <dttm>library(tidyverse)library(nycflights13)data(package = "nycflights13")# 包含airlines、airports、flights、planes、weather等5个数据集flights # just print() it#> # A tibble: 336,776 × 19#> year month day dep_time sched_dep_time dep_delay arr_time sched_arr_time arr_delay#> <int> <int> <int> <int> <int> <dbl> <int> <int> <dbl>#> 1 2013 1 1 517 515 2 830 819 11#> 2 2013 1 1 533 529 4 850 830 20#> 3 2013 1 1 542 540 2 923 850 33#> # ℹ 336,773 more rows#> # ℹ 10 more variables: carrier <chr>, flight <int>, tailnum <chr>, origin <chr>,#> # dest <chr>, air_time <dbl>, distance <dbl>, hour <dbl>, minute <dbl>,#> # time_hour <dttm>
A tibble: 336,776 x 19<int>|<dbl>|<chr>|<dttm>|<lgl>|<fctr>|<date>分别表示变量为 integer | double | character | date-time | logical | factor | date 类型的向量
library(tidyverse)library(nycflights13)data(package = "nycflights13")# 包含airlines、airports、flights、planes、weather等5个数据集flights # just print() it#> # A tibble: 336,776 × 19#> year month day dep_time sched_dep_time dep_delay arr_time sched_arr_time arr_delay#> <int> <int> <int> <int> <int> <dbl> <int> <int> <dbl>#> 1 2013 1 1 517 515 2 830 819 11#> 2 2013 1 1 533 529 4 850 830 20#> 3 2013 1 1 542 540 2 923 850 33#> # ℹ 336,773 more rows#> # ℹ 10 more variables: carrier <chr>, flight <int>, tailnum <chr>, origin <chr>,#> # dest <chr>, air_time <dbl>, distance <dbl>, hour <dbl>, minute <dbl>,#> # time_hour <dttm>
A tibble: 336,776 x 19<int>|<dbl>|<chr>|<dttm>|<lgl>|<fctr>|<date>分别表示变量为 integer | double | character | date-time | logical | factor | date 类型的向量
?flights # 打开flights数据集的帮助文档以进一步了解数据集,如变量的定义glimpse(flights) # 数据一瞥#> Rows: 336,776#> Columns: 19#> $ year <int> 2013, 2013, 2013, 2013, 2013, 2013, 2013, 2013, 2013, 2013, 2013,…#> $ month <int> 1, 1, 1, 1, 1, 1, 1, 1, 1, 1, 1, 1, 1, 1, 1, 1, 1, 1, 1, 1, 1, 1,…#> $ day <int> 1, 1, 1, 1, 1, 1, 1, 1, 1, 1, 1, 1, 1, 1, 1, 1, 1, 1, 1, 1, 1, 1,…#> $ dep_time <int> 517, 533, 542, 544, 554, 554, 555, 557, 557, 558, 558, 558, 558, …#> $ sched_dep_time <int> 515, 529, 540, 545, 600, 558, 600, 600, 600, 600, 600, 600, 600, …#> $ dep_delay <dbl> 2, 4, 2, -1, -6, -4, -5, -3, -3, -2, -2, -2, -2, -2, -1, 0, -1, 0…#> $ arr_time <int> 830, 850, 923, 1004, 812, 740, 913, 709, 838, 753, 849, 853, 924,…#> $ sched_arr_time <int> 819, 830, 850, 1022, 837, 728, 854, 723, 846, 745, 851, 856, 917,…#> $ arr_delay <dbl> 11, 20, 33, -18, -25, 12, 19, -14, -8, 8, -2, -3, 7, -14, 31, -4,…#> $ carrier <chr> "UA", "UA", "AA", "B6", "DL", "UA", "B6", "EV", "B6", "AA", "B6",…#> $ flight <int> 1545, 1714, 1141, 725, 461, 1696, 507, 5708, 79, 301, 49, 71, 194…#> $ tailnum <chr> "N14228", "N24211", "N619AA", "N804JB", "N668DN", "N39463", "N516…#> $ origin <chr> "EWR", "LGA", "JFK", "JFK", "LGA", "EWR", "EWR", "LGA", "JFK", "L…#> $ dest <chr> "IAH", "IAH", "MIA", "BQN", "ATL", "ORD", "FLL", "IAD", "MCO", "O…#> $ air_time <dbl> 227, 227, 160, 183, 116, 150, 158, 53, 140, 138, 149, 158, 345, 3…#> $ distance <dbl> 1400, 1416, 1089, 1576, 762, 719, 1065, 229, 944, 733, 1028, 1005…#> $ hour <dbl> 5, 5, 5, 5, 6, 5, 6, 6, 6, 6, 6, 6, 6, 6, 6, 5, 6, 6, 6, 6, 6, 6,…#> $ minute <dbl> 15, 29, 40, 45, 0, 58, 0, 0, 0, 0, 0, 0, 0, 0, 0, 59, 0, 0, 0, 0,…#> $ time_hour <dttm> 2013-01-01 05:00:00, 2013-01-01 05:00:00, 2013-01-01 05:00:00, 2…glimpse(flights) # 数据一瞥#> Rows: 336,776#> Columns: 19#> $ year <int> 2013, 2013, 2013, 2013, 2013, 2013, 2013, 2013, 2013, 2013, 2013,…#> $ month <int> 1, 1, 1, 1, 1, 1, 1, 1, 1, 1, 1, 1, 1, 1, 1, 1, 1, 1, 1, 1, 1, 1,…#> $ day <int> 1, 1, 1, 1, 1, 1, 1, 1, 1, 1, 1, 1, 1, 1, 1, 1, 1, 1, 1, 1, 1, 1,…#> $ dep_time <int> 517, 533, 542, 544, 554, 554, 555, 557, 557, 558, 558, 558, 558, …#> $ sched_dep_time <int> 515, 529, 540, 545, 600, 558, 600, 600, 600, 600, 600, 600, 600, …#> $ dep_delay <dbl> 2, 4, 2, -1, -6, -4, -5, -3, -3, -2, -2, -2, -2, -2, -1, 0, -1, 0…#> $ arr_time <int> 830, 850, 923, 1004, 812, 740, 913, 709, 838, 753, 849, 853, 924,…#> $ sched_arr_time <int> 819, 830, 850, 1022, 837, 728, 854, 723, 846, 745, 851, 856, 917,…#> $ arr_delay <dbl> 11, 20, 33, -18, -25, 12, 19, -14, -8, 8, -2, -3, 7, -14, 31, -4,…#> $ carrier <chr> "UA", "UA", "AA", "B6", "DL", "UA", "B6", "EV", "B6", "AA", "B6",…#> $ flight <int> 1545, 1714, 1141, 725, 461, 1696, 507, 5708, 79, 301, 49, 71, 194…#> $ tailnum <chr> "N14228", "N24211", "N619AA", "N804JB", "N668DN", "N39463", "N516…#> $ origin <chr> "EWR", "LGA", "JFK", "JFK", "LGA", "EWR", "EWR", "LGA", "JFK", "L…#> $ dest <chr> "IAH", "IAH", "MIA", "BQN", "ATL", "ORD", "FLL", "IAD", "MCO", "O…#> $ air_time <dbl> 227, 227, 160, 183, 116, 150, 158, 53, 140, 138, 149, 158, 345, 3…#> $ distance <dbl> 1400, 1416, 1089, 1576, 762, 719, 1065, 229, 944, 733, 1028, 1005…#> $ hour <dbl> 5, 5, 5, 5, 6, 5, 6, 6, 6, 6, 6, 6, 6, 6, 6, 5, 6, 6, 6, 6, 6, 6,…#> $ minute <dbl> 15, 29, 40, 45, 0, 58, 0, 0, 0, 0, 0, 0, 0, 0, 0, 59, 0, 0, 0, 0,…#> $ time_hour <dttm> 2013-01-01 05:00:00, 2013-01-01 05:00:00, 2013-01-01 05:00:00, 2…View(flights) # 在 RStudio 数据浏览器中打开数据集# tibble::view() 调用 utils::View() 并不可见地返回原数据集,便于 %>% 操作,但速度好像慢很多🤔 想想
05:00
对于如下由行(样本)和列(变量)构成的数据集 / 数据表我们可以进行哪些方面的操作呢?
| year | month | day | dep_time | dep_delay | arr_delay | air_time | carrier | origin | dest | |
|---|---|---|---|---|---|---|---|---|---|---|
| 1 | 2013 | 1 | 7 | 831 | -3 | -21 | 138 | UA | EWR | MCO |
| 2 | 2013 | 1 | 13 | 828 | 4 | -17 | 140 | UA | EWR | MCO |
| 3 | 2013 | 1 | 22 | 1915 | 0 | 2 | 129 | 9E | JFK | ORD |
| 4 | 2013 | 2 | 6 | 2153 | -6 | -22 | 46 | EV | EWR | BTV |
| 5 | 2013 | 3 | 9 | 1708 | -2 | 3 | 223 | AA | JFK | AUS |
| 6 | 2013 | 4 | 5 | 1813 | -2 | -16 | 96 | DL | EWR | ATL |
| 7 | 2013 | 4 | 27 | 605 | -1 | -24 | 141 | UA | EWR | FLL |
| 8 | 2013 | 6 | 12 | 605 | -10 | -36 | 68 | US | EWR | CLT |
1. 样本处理
(manipulate cases)
>> 样本筛选:filter()
filter(.data, ...):提取数据集 .data 中变量取值满足设定条件的样本
filter(flights, month == 1, day == 1)# 注意:条件表达式中的是 ==,而不是 =#> # A tibble: 842 × 19#> year month day dep_time sched_dep_time dep_delay arr_time sched_arr_time arr_delay#> <int> <int> <int> <int> <int> <dbl> <int> <int> <dbl>#> 1 2013 1 1 517 515 2 830 819 11#> 2 2013 1 1 533 529 4 850 830 20#> 3 2013 1 1 542 540 2 923 850 33#> # ℹ 839 more rows#> # ℹ 10 more variables: carrier <chr>, flight <int>, tailnum <chr>, origin <chr>,#> # dest <chr>, air_time <dbl>, distance <dbl>, hour <dbl>, minute <dbl>,#> # time_hour <dttm>>> 样本筛选:filter()
filter(.data, ...):提取数据集 .data 中变量取值满足设定条件的样本
filter(flights, month == 1, day == 1)# 注意:条件表达式中的是 ==,而不是 =#> # A tibble: 842 × 19#> year month day dep_time sched_dep_time dep_delay arr_time sched_arr_time arr_delay#> <int> <int> <int> <int> <int> <dbl> <int> <int> <dbl>#> 1 2013 1 1 517 515 2 830 819 11#> 2 2013 1 1 533 529 4 850 830 20#> 3 2013 1 1 542 540 2 923 850 33#> # ℹ 839 more rows#> # ℹ 10 more variables: carrier <chr>, flight <int>, tailnum <chr>, origin <chr>,#> # dest <chr>, air_time <dbl>, distance <dbl>, hour <dbl>, minute <dbl>,#> # time_hour <dttm># 在 R 基础包中的实现方法flights[flights$month == 1 & flights$day == 1, ]subset(flights, month == 1 & day == 1)flights[month == 1 & day == 1, ] # 注意:这样写是错滴#> Error in month == 1: comparison (==) is possible only for atomic and list types>> 样本筛选:filter()
dplyr 包中的函数(如 filter() )并不会直接修改输入数据集 .data
你必须自行存储修改后的数据集 💾
dec25 <- filter(flights, month == 12, day == 25)dec25#> # A tibble: 719 × 19#> year month day dep_time sched_dep_time dep_delay arr_time sched_arr_time arr_delay#> <int> <int> <int> <int> <int> <dbl> <int> <int> <dbl>#> 1 2013 12 25 456 500 -4 649 651 -2#> 2 2013 12 25 524 515 9 805 814 -9#> 3 2013 12 25 542 540 2 832 850 -18#> # ℹ 716 more rows#> # ℹ 10 more variables: carrier <chr>, flight <int>, tailnum <chr>, origin <chr>,#> # dest <chr>, air_time <dbl>, distance <dbl>, hour <dbl>, minute <dbl>,#> # time_hour <dttm>flights # 输入数据集仍然保持不变#> # A tibble: 336,776 × 19#> year month day dep_time sched_dep_time dep_delay arr_time sched_arr_time arr_delay#> <int> <int> <int> <int> <int> <dbl> <int> <int> <dbl>#> 1 2013 1 1 517 515 2 830 819 11#> 2 2013 1 1 533 529 4 850 830 20#> 3 2013 1 1 542 540 2 923 850 33#> # ℹ 336,773 more rows#> # ℹ 10 more variables: carrier <chr>, flight <int>, tailnum <chr>, origin <chr>,#> # dest <chr>, air_time <dbl>, distance <dbl>, hour <dbl>, minute <dbl>,#> # time_hour <dttm>>> 样本筛选:filter()
filter() 会用到的比较运算符和逻辑运算符
1. < > <= >= == != # ?Comparison 2. & | ! xor() # ?base::Logic 3. 其它的如:%in%、is.na()、between()、near()、if_any()、if_all() 等filter() 默认以 & 的方式组合多个条件参数,...
filter(flights, month >= 11, day == 25) # 等效于filter(flights, month >= 11 & day == 25)... 其它逻辑组合方式(如|)则需自行设定
🤔 想想
05:00
怎样挑出11月和12月的航班样本呢?
1) filter(flights, month == 11 | 12)
2) filter(flights, month == (11 | 12))
3) filter(flights, month == 11 | month == 12)
filter(flights, month == 11 | 12)#> # A tibble: 336,776 × 19#> year month day dep_time sched_dep_time dep_delay arr_time sched_arr_time arr_delay#> <int> <int> <int> <int> <int> <dbl> <int> <int> <dbl>#> 1 2013 1 1 517 515 2 830 819 11#> 2 2013 1 1 533 529 4 850 830 20#> 3 2013 1 1 542 540 2 923 850 33#> # ℹ 336,773 more rows#> # ℹ 10 more variables: carrier <chr>, flight <int>, tailnum <chr>, origin <chr>,#> # dest <chr>, air_time <dbl>, distance <dbl>, hour <dbl>, minute <dbl>,#> # time_hour <dttm>filter(flights, month == (11 | 12))#> # A tibble: 27,004 × 19#> year month day dep_time sched_dep_time dep_delay arr_time sched_arr_time arr_delay#> <int> <int> <int> <int> <int> <dbl> <int> <int> <dbl>#> 1 2013 1 1 517 515 2 830 819 11#> 2 2013 1 1 533 529 4 850 830 20#> 3 2013 1 1 542 540 2 923 850 33#> # ℹ 27,001 more rows#> # ℹ 10 more variables: carrier <chr>, flight <int>, tailnum <chr>, origin <chr>,#> # dest <chr>, air_time <dbl>, distance <dbl>, hour <dbl>, minute <dbl>,#> # time_hour <dttm>filter(flights, month == 11 | month == 12)# filter(flights, month %in% c(11, 12))#> # A tibble: 55,403 × 19#> year month day dep_time sched_dep_time dep_delay arr_time sched_arr_time arr_delay#> <int> <int> <int> <int> <int> <dbl> <int> <int> <dbl>#> 1 2013 11 1 5 2359 6 352 345 7#> 2 2013 11 1 35 2250 105 123 2356 87#> 3 2013 11 1 455 500 -5 641 651 -10#> # ℹ 55,400 more rows#> # ℹ 10 more variables: carrier <chr>, flight <int>, tailnum <chr>, origin <chr>,#> # dest <chr>, air_time <dbl>, distance <dbl>, hour <dbl>, minute <dbl>,#> # time_hour <dttm>>> 样本筛选:其它函数
slice(.data, ..., .by = NULL, .preserve = FALSE):按照整数向量给出的索引位置选择样本,正(负)整数表示保留(移除)的样本,如slice(mtcars, 5:n())slice_head(.data, ..., n, prop, by = NULL)和slice_tail()选择数据集开始 / 结尾的样本 vs.utils::head() / tail()?slice_sample(.data, ..., n, prop, by = NULL, weight_by = NULL, replace = FALSE)随机选择样本slice_min(.data, order_by, ..., n, prop, by = NULL, with_ties = TRUE, na_rm = FALSE)和slice_max()选择order_by参数指定的变量或其函数取值最大或最小的样本distinct(.data, ..., .keep_all = FALSE):移除(指定变量或其函数)取值重复的样本 ≈base::unique()
注: 在 dplyrv1.0.0 之后 top_n()、top_frac()、sample_n() 和 sample_frac() 等函数已被相应的 slice_*() 函数所替代
>> 样本排序:arrange()
arrange(.data, ...):根据指定变量的取值对数据集 .data 的样本排序
arrange(flights, year, month, day, dep_time)#> # A tibble: 336,776 × 19#> year month day dep_time sched_dep_time dep_delay arr_time sched_arr_time arr_delay#> <int> <int> <int> <int> <int> <dbl> <int> <int> <dbl>#> 1 2013 1 1 517 515 2 830 819 11#> 2 2013 1 1 533 529 4 850 830 20#> 3 2013 1 1 542 540 2 923 850 33#> # ℹ 336,773 more rows#> # ℹ 10 more variables: carrier <chr>, flight <int>, tailnum <chr>, origin <chr>,#> # dest <chr>, air_time <dbl>, distance <dbl>, hour <dbl>, minute <dbl>,#> # time_hour <dttm>>> 样本排序:arrange()
arrange(.data, ...):根据指定变量的取值对数据集 .data 的样本排序
arrange(flights, year, month, day, dep_time)#> # A tibble: 336,776 × 19#> year month day dep_time sched_dep_time dep_delay arr_time sched_arr_time arr_delay#> <int> <int> <int> <int> <int> <dbl> <int> <int> <dbl>#> 1 2013 1 1 517 515 2 830 819 11#> 2 2013 1 1 533 529 4 850 830 20#> 3 2013 1 1 542 540 2 923 850 33#> # ℹ 336,773 more rows#> # ℹ 10 more variables: carrier <chr>, flight <int>, tailnum <chr>, origin <chr>,#> # dest <chr>, air_time <dbl>, distance <dbl>, hour <dbl>, minute <dbl>,#> # time_hour <dttm>arrange(flights, desc(dep_delay)) # 加入 desc() 反向排序:从大到小#> # A tibble: 336,776 × 19#> year month day dep_time sched_dep_time dep_delay arr_time sched_arr_time arr_delay#> <int> <int> <int> <int> <int> <dbl> <int> <int> <dbl>#> 1 2013 1 9 641 900 1301 1242 1530 1272#> 2 2013 6 15 1432 1935 1137 1607 2120 1127#> 3 2013 1 10 1121 1635 1126 1239 1810 1109#> # ℹ 336,773 more rows#> # ℹ 10 more variables: carrier <chr>, flight <int>, tailnum <chr>, origin <chr>,#> # dest <chr>, air_time <dbl>, distance <dbl>, hour <dbl>, minute <dbl>,#> # time_hour <dttm>>> 样本排序:arrange()
不像 dplyr 包中的其它函数,arrange(.data, ..., .by_group = FALSE) 会忽略数据集的分组信息,除非明确加入分组变量或设定 .by_group = TRUE
缺失值总是排在最后 *
df <- tibble(x = c(1, 3, 2, NA))arrange(df, x)#> # A tibble: 4 × 1#> x#> <dbl>#> 1 1#> 2 2#> 3 3#> 4 NAdf <- tibble(x = c(1, 3, 2, NA))arrange(df, desc(x))#> # A tibble: 4 × 1#> x#> <dbl>#> 1 3#> 2 2#> 3 1#> 4 NA>> 样本排序:arrange()
不像 dplyr 包中的其它函数,arrange(.data, ..., .by_group = FALSE) 会忽略数据集的分组信息,除非明确加入分组变量或设定 .by_group = TRUE
缺失值总是排在最后 *
df <- tibble(x = c(1, 3, 2, NA))arrange(df, x)#> # A tibble: 4 × 1#> x#> <dbl>#> 1 1#> 2 2#> 3 3#> 4 NAdf <- tibble(x = c(1, 3, 2, NA))arrange(df, desc(x))#> # A tibble: 4 × 1#> x#> <dbl>#> 1 3#> 2 2#> 3 1#> 4 NA*:base::sort() 和 base::order() 通过参数 na.last 来控制把缺失值放在哪里或删除,并通过参数 decreasing 来控制排序方向。
2. 变量处理
(manipulate variables)
>> 变量选取:select(.data, ...)
select(flights, month, day, dep_time, sched_dep_time, dep_delay) # 枚举式:变量名,无需""#> # A tibble: 336,776 × 5#> month day dep_time sched_dep_time dep_delay#> <int> <int> <int> <int> <dbl>#> 1 1 1 517 515 2#> 2 1 1 533 529 4#> 3 1 1 542 540 2#> # ℹ 336,773 more rowsselect(flights, 2, 3, 4, 5, 6) # 枚举式:表示变量位置的数字,结果同上,但不推荐>> 变量选取:select(.data, ...)
select(flights, month, day, dep_time, sched_dep_time, dep_delay) # 枚举式:变量名,无需""#> # A tibble: 336,776 × 5#> month day dep_time sched_dep_time dep_delay#> <int> <int> <int> <int> <dbl>#> 1 1 1 517 515 2#> 2 1 1 533 529 4#> 3 1 1 542 540 2#> # ℹ 336,773 more rowsselect(flights, 2, 3, 4, 5, 6) # 枚举式:表示变量位置的数字,结果同上,但不推荐select(flights, month:dep_delay) # 用 : 选择连在一起的变量select(flights, 2:6)>> 变量选取:select(.data, ...)
select(flights, month, day, dep_time, sched_dep_time, dep_delay) # 枚举式:变量名,无需""#> # A tibble: 336,776 × 5#> month day dep_time sched_dep_time dep_delay#> <int> <int> <int> <int> <dbl>#> 1 1 1 517 515 2#> 2 1 1 533 529 4#> 3 1 1 542 540 2#> # ℹ 336,773 more rowsselect(flights, 2, 3, 4, 5, 6) # 枚举式:表示变量位置的数字,结果同上,但不推荐select(flights, month:dep_delay) # 用 : 选择连在一起的变量select(flights, 2:6)select(flights, !(month:dep_delay)) # 变量前的 ! 或 - 表示剔除#> # A tibble: 336,776 × 14#> year arr_time sched_arr_time arr_delay carrier flight tailnum origin dest air_time#> <int> <int> <int> <dbl> <chr> <int> <chr> <chr> <chr> <dbl>#> 1 2013 830 819 11 UA 1545 N14228 EWR IAH 227#> 2 2013 850 830 20 UA 1714 N24211 LGA IAH 227#> 3 2013 923 850 33 AA 1141 N619AA JFK MIA 160#> # ℹ 336,773 more rows#> # ℹ 4 more variables: distance <dbl>, hour <dbl>, minute <dbl>, time_hour <dttm>>> 变量选取:select(.data, ...)
select() 的帮助函数,已析出到 tidyselect 包中,?select_helpers
starts_with("abc"):选取变量名以abc开头的变量ends_with("xyz"):选取变量名以xyz结束的变量contains("ijk"):选取变量名包含ijk的变量matches("(.)\\1"):选取变量名中出现重复字符的变量num_range("x", 1:3):选取变量x1、x2和x3any_of(x) | all_of(x):选择整数向量x指定位置或字符向量x直接指定的变量last_col(offset = 0L):选择从最后算起的第offset+1个的变量everything():全部变量,通常放在最后where(fn):选择满足断言函数fn条件的变量,如select(data, where(is.integer))
>> 变量选取:select(.data, ...)
select() 的帮助函数,已析出到 tidyselect 包中,?select_helpers
starts_with("abc"):选取变量名以abc开头的变量ends_with("xyz"):选取变量名以xyz结束的变量contains("ijk"):选取变量名包含ijk的变量matches("(.)\\1"):选取变量名中出现重复字符的变量num_range("x", 1:3):选取变量x1、x2和x3any_of(x) | all_of(x):选择整数向量x指定位置或字符向量x直接指定的变量last_col(offset = 0L):选择从最后算起的第offset+1个的变量everything():全部变量,通常放在最后where(fn):选择满足断言函数fn条件的变量,如select(data, where(is.integer))
select():可混合使用各种方法
select(flights, year:day, ends_with("_delay") | starts_with("dep_"), tailnum)#> # A tibble: 336,776 × 7#> year month day dep_delay arr_delay dep_time tailnum#> <int> <int> <int> <dbl> <dbl> <int> <chr> #> 1 2013 1 1 2 11 517 N14228 #> 2 2013 1 1 4 20 533 N24211 #> 3 2013 1 1 2 33 542 N619AA #> # ℹ 336,773 more rows>> 变量重命名:select()、rename() 和 rename_with()
select(flights, nian = year, yue = month, ri = day) # 选取变量的同时重命名变量#> # A tibble: 336,776 × 3#> nian yue ri#> <int> <int> <int>#> 1 2013 1 1#> 2 2013 1 1#> 3 2013 1 1#> # ℹ 336,773 more rows# select() 只保留指定的变量,而 rename(.data, ...) 则会保留全部变量rename(flights, nian = year, yue = month, ri = day) %>% dim()#> [1] 336776 19>> 变量重命名:select()、rename() 和 rename_with()
select(flights, nian = year, yue = month, ri = day) # 选取变量的同时重命名变量#> # A tibble: 336,776 × 3#> nian yue ri#> <int> <int> <int>#> 1 2013 1 1#> 2 2013 1 1#> 3 2013 1 1#> # ℹ 336,773 more rows# select() 只保留指定的变量,而 rename(.data, ...) 则会保留全部变量rename(flights, nian = year, yue = month, ri = day) %>% dim()#> [1] 336776 19# rename_with(.data, .fn, .cols = everything(), ...)rename_with(flights, toupper, 1:3)#> # A tibble: 336,776 × 19#> YEAR MONTH DAY dep_time sched_dep_time dep_delay arr_time sched_arr_time arr_delay#> <int> <int> <int> <int> <int> <dbl> <int> <int> <dbl>#> 1 2013 1 1 517 515 2 830 819 11#> 2 2013 1 1 533 529 4 850 830 20#> 3 2013 1 1 542 540 2 923 850 33#> # ℹ 336,773 more rows#> # ℹ 10 more variables: carrier <chr>, flight <int>, tailnum <chr>, origin <chr>,#> # dest <chr>, air_time <dbl>, distance <dbl>, hour <dbl>, minute <dbl>,#> # time_hour <dttm>>> 变量次序调整:select() 和 relocate()
select(flights, dest, year:day, ends_with("_delay"), everything())#> # A tibble: 336,776 × 19#> dest year month day dep_delay arr_delay dep_time sched_dep_time arr_time#> <chr> <int> <int> <int> <dbl> <dbl> <int> <int> <int>#> 1 IAH 2013 1 1 2 11 517 515 830#> 2 IAH 2013 1 1 4 20 533 529 850#> 3 MIA 2013 1 1 2 33 542 540 923#> # ℹ 336,773 more rows#> # ℹ 10 more variables: sched_arr_time <int>, carrier <chr>, flight <int>, tailnum <chr>,#> # origin <chr>, air_time <dbl>, distance <dbl>, hour <dbl>, minute <dbl>,#> # time_hour <dttm>>> 变量次序调整:select() 和 relocate()
select(flights, dest, year:day, ends_with("_delay"), everything())#> # A tibble: 336,776 × 19#> dest year month day dep_delay arr_delay dep_time sched_dep_time arr_time#> <chr> <int> <int> <int> <dbl> <dbl> <int> <int> <int>#> 1 IAH 2013 1 1 2 11 517 515 830#> 2 IAH 2013 1 1 4 20 533 529 850#> 3 MIA 2013 1 1 2 33 542 540 923#> # ℹ 336,773 more rows#> # ℹ 10 more variables: sched_arr_time <int>, carrier <chr>, flight <int>, tailnum <chr>,#> # origin <chr>, air_time <dbl>, distance <dbl>, hour <dbl>, minute <dbl>,#> # time_hour <dttm>relocate(flights, dest, year:day, ends_with("_delay")) # 结果同上>> 变量次序调整:select() 和 relocate()
select(flights, dest, year:day, ends_with("_delay"), everything())#> # A tibble: 336,776 × 19#> dest year month day dep_delay arr_delay dep_time sched_dep_time arr_time#> <chr> <int> <int> <int> <dbl> <dbl> <int> <int> <int>#> 1 IAH 2013 1 1 2 11 517 515 830#> 2 IAH 2013 1 1 4 20 533 529 850#> 3 MIA 2013 1 1 2 33 542 540 923#> # ℹ 336,773 more rows#> # ℹ 10 more variables: sched_arr_time <int>, carrier <chr>, flight <int>, tailnum <chr>,#> # origin <chr>, air_time <dbl>, distance <dbl>, hour <dbl>, minute <dbl>,#> # time_hour <dttm>relocate(flights, dest, year:day, ends_with("_delay")) # 结果同上# relocate(.data, ..., .before = NULL, .after = NULL)relocate(flights, ends_with("_delay"), .after = day)#> # A tibble: 336,776 × 19#> year month day dep_delay arr_delay dep_time sched_dep_time arr_time sched_arr_time#> <int> <int> <int> <dbl> <dbl> <int> <int> <int> <int>#> 1 2013 1 1 2 11 517 515 830 819#> 2 2013 1 1 4 20 533 529 850 830#> 3 2013 1 1 2 33 542 540 923 850#> # ℹ 336,773 more rows#> # ℹ 10 more variables: carrier <chr>, flight <int>, tailnum <chr>, origin <chr>,#> # dest <chr>, air_time <dbl>, distance <dbl>, hour <dbl>, minute <dbl>,#> # time_hour <dttm>>> 生成新变量:mutate()
mutate(.data, ...):生成新变量 *
flights_sml <- select(flights, year:day, ends_with("_delay"), air_time)mutate(flights_sml, gain = arr_delay - dep_delay, hours = air_time / 60, gain_per_hour = gain / hours # 可直接引用新生成的变量)#> # A tibble: 336,776 × 9#> year month day dep_delay arr_delay air_time gain hours gain_per_hour#> <int> <int> <int> <dbl> <dbl> <dbl> <dbl> <dbl> <dbl>#> 1 2013 1 1 2 11 227 9 3.78 2.38#> 2 2013 1 1 4 20 227 16 3.78 4.23#> 3 2013 1 1 2 33 160 31 2.67 11.6 #> # ℹ 336,773 more rows>> 生成新变量:mutate()
mutate(.data, ...):生成新变量 *
flights_sml <- select(flights, year:day, ends_with("_delay"), air_time)mutate(flights_sml, gain = arr_delay - dep_delay, hours = air_time / 60, gain_per_hour = gain / hours # 可直接引用新生成的变量)#> # A tibble: 336,776 × 9#> year month day dep_delay arr_delay air_time gain hours gain_per_hour#> <int> <int> <int> <dbl> <dbl> <dbl> <dbl> <dbl> <dbl>#> 1 2013 1 1 2 11 227 9 3.78 2.38#> 2 2013 1 1 4 20 227 16 3.78 4.23#> 3 2013 1 1 2 33 160 31 2.67 11.6 #> # ℹ 336,773 more rows*:完整参数版为 mutate(.data, ..., .by = NULL, .keep = c("all", "used", "unused", "none"), .before = NULL, .after = NULL)(其中:.keep、.before和.after为 dplyrv1.0.0 新增参数,dplyrv1.1.0 又新增实验性参数 .by);
2. 假如你只想保留新生成的变量,那就使用 设定 transmute() 或mutate() 参数 .keep = "none"。
>> 生成新变量:mutate()
mutate():支持向量化函数 *
MATH +, - , *, /, ^, %/%, %% # arithmetic ops log(), log2(), log10() # logs <, <=, >, >=, !=, == # logical comparisonsCUMULATIVE AGGREGATES # vignette("window-functions") dplyr::cumall()|cumany() # cumulative all() | any() cummax()|cummin() # cumulative max() | min() dplyr::cummean() # cumulative mean() cumprod()|cumsum() # cumulative prod() | sum()OFFSETS dplyr::lag()|lead() # offset elements by 1 | -1RANKINGS # ?ranking dplyr::min_rank() # rank with ties = min dplyr::ntile() # bins into n bins dplyr::row_number() # rank with ties = "first"MISC pmax()|pmin() # element-wise max() | min() dplyr::recode() # vectorized switch() dplyr::if_else() # vectorized if() + else() dplyr::case_when() # multi-case if_else()*:当然也支持返回“标量”的汇总函数,如 mean(),会将标量直接扩展至需要的长度。
>> 生成新变量:mutate()
多列操作 👉 vignette("colwise")
# ?scoped# *_all() 作用于每个变量# *_at() 作用于用 vars() 函数、字符向量或位置向量指定的变量# *_if() 作用于 .predicate 函数取值为 TRUE 的变量mutate_all(.tbl, .funs, ...)mutate_at(.tbl, .vars, .funs, ...)mutate_if(.tbl, .predicate, .funs, ...)# summarize()、group_by()、arrange()、filter()、rename()等也存在类似的变体函数>> 生成新变量:mutate()
多列操作 👉 vignette("colwise")
# ?scoped# *_all() 作用于每个变量# *_at() 作用于用 vars() 函数、字符向量或位置向量指定的变量# *_if() 作用于 .predicate 函数取值为 TRUE 的变量mutate_all(.tbl, .funs, ...)mutate_at(.tbl, .vars, .funs, ...)mutate_if(.tbl, .predicate, .funs, ...)# summarize()、group_by()、arrange()、filter()、rename()等也存在类似的变体函数dplyrv1.0.0 使用更具优势的 across(.cols = everything(), .fns = NULL, ..., .names = NULL, .unpack = FALSE) 来替代上述为数众多的变体函数
mutate(flights_sml, across(dep_delay:air_time, \(x) x / 60)) # 匿名函数#> # A tibble: 336,776 × 6#> year month day dep_delay arr_delay air_time#> <int> <int> <int> <dbl> <dbl> <dbl>#> 1 2013 1 1 0.0333 0.183 3.78#> 2 2013 1 1 0.0667 0.333 3.78#> 3 2013 1 1 0.0333 0.55 2.67#> # ℹ 336,773 more rows3. 汇总
(summarize / reframe)
>> 汇总:summarize()
summarize(.data, ..., .by = NULL, .groups = NULL)函数生成新的数据框,每个汇总函数占一列,每个分组占用一行;如果
.data是分组数据框 👇,则每个分组变量还会占一列;此时,还可用 dplyrv1.0.0 新增的实验性参数.groups = c("drop_last", "drop", "keep", "rowwise")来控制新生成结果数据框的分组结构;如果只想对
.data进行一次性的分组汇总(不保留分组结构),则可使用 dplyrv1.1.0 新增的实验性分组参数.by。
summarize( flights, mean_delay = mean(dep_delay, na.rm = TRUE), sd_delay = sd(dep_delay, na.rm = TRUE))#> # A tibble: 1 × 2#> mean_delay sd_delay#> <dbl> <dbl>#> 1 12.6 40.2>> 汇总:summarize()
summarize() 支持返回“标量”的汇总函数*,示例如下:
COUNTS dplyr::n() # number of values/rows dplyr::n_distinct() # number of uniques sum(!is.na()) # number of non-NA’sLOCATION mean() | median() # mean | medianPOSITION/ORDER dplyr::first() # first value dplyr::last() # last value dplyr::nth() # value in n-th location of vectorRANK quantile() # nth quantile min() | max() # minimum value | maximum valueSPREAD IQR() # Inter-Quartile Range mad() # median absolute deviation sd() # standard deviation var() # variance*:dplyrv1.0.0 扩展了 summarize() 的灵活性(允许其返回包含多个元素的向量甚至是多行多列的数据框),但 dplyrv1.1.0 在此应用情景下会提示改用实验性的 reframe()。
>> 灵活汇总:reframe()
quantile_df <- function(x, probs) { tibble(x = quantile(x, probs, na.rm = TRUE), probs = probs)}flights %>% summarize( across(c(dep_delay, arr_delay), ~ quantile_df( .x, seq(0, 1, 0.25) ), .unpack = TRUE ) )#> Warning: Returning more (or less) than 1 row per `summarise()` group was deprecated in dplyr#> 1.1.0.#> ℹ Please use `reframe()` instead.#> ℹ When switching from `summarise()` to `reframe()`, remember that `reframe()` always#> returns an ungrouped data frame and adjust accordingly.#> Call `lifecycle::last_lifecycle_warnings()` to see where this warning was generated.#> # A tibble: 5 × 4#> dep_delay_x dep_delay_probs arr_delay_x arr_delay_probs#> <dbl> <dbl> <dbl> <dbl>#> 1 -43 0 -86 0 #> 2 -5 0.25 -17 0.25#> 3 -2 0.5 -5 0.5 #> 4 11 0.75 14 0.75#> 5 1301 1 1272 1>> 灵活汇总:reframe()
quantile_df <- function(x, probs) { tibble(x = quantile(x, probs, na.rm = TRUE), probs = probs)}flights %>% summarize( across(c(dep_delay, arr_delay), ~ quantile_df( .x, seq(0, 1, 0.25) ), .unpack = TRUE ) )#> Warning: Returning more (or less) than 1 row per `summarise()` group was deprecated in dplyr#> 1.1.0.#> ℹ Please use `reframe()` instead.#> ℹ When switching from `summarise()` to `reframe()`, remember that `reframe()` always#> returns an ungrouped data frame and adjust accordingly.#> Call `lifecycle::last_lifecycle_warnings()` to see where this warning was generated.#> # A tibble: 5 × 4#> dep_delay_x dep_delay_probs arr_delay_x arr_delay_probs#> <dbl> <dbl> <dbl> <dbl>#> 1 -43 0 -86 0 #> 2 -5 0.25 -17 0.25#> 3 -2 0.5 -5 0.5 #> 4 11 0.75 14 0.75#> 5 1301 1 1272 1flights %>% reframe( across(c(dep_delay, arr_delay), ~ quantile_df( .x, seq(0, 1, 0.25) ), .unpack = TRUE ) )#> # A tibble: 5 × 4#> dep_delay_x dep_delay_probs arr_delay_x arr_delay_probs#> <dbl> <dbl> <dbl> <dbl>#> 1 -43 0 -86 0 #> 2 -5 0.25 -17 0.25#> 3 -2 0.5 -5 0.5 #> 4 11 0.75 14 0.75#> 5 1301 1 1272 14. 分组和行式处理
(grouping and rowwise)
>> 分组处理:group_by() 👉 vignette("grouping")
group_by(.data, ..., .add = FALSE, .drop = group_by_drop_default(.data))将数据框及其扩展转变为分组数据框(grouped_df)
by_day <- group_by(flights, year, month, day)class(by_day)#> [1] "grouped_df" "tbl_df" "tbl" #> [4] "data.frame"by_day#> # A tibble: 336,776 × 19#> # Groups: year, month, day [365]#> year month day dep_time sched_dep_time#> <int> <int> <int> <int> <int>#> 1 2013 1 1 517 515#> 2 2013 1 1 533 529#> 3 2013 1 1 542 540#> # ℹ 336,773 more rows#> # ℹ 14 more variables: dep_delay <dbl>,#> # arr_time <int>, sched_arr_time <int>,#> # arr_delay <dbl>, carrier <chr>,#> # flight <int>, tailnum <chr>,#> # origin <chr>, dest <chr>,#> # air_time <dbl>, distance <dbl>, …>> 分组处理:group_by() 👉 vignette("grouping")
group_by(.data, ..., .add = FALSE, .drop = group_by_drop_default(.data))将数据框及其扩展转变为分组数据框(grouped_df)
by_day <- group_by(flights, year, month, day)class(by_day)#> [1] "grouped_df" "tbl_df" "tbl" #> [4] "data.frame"by_day#> # A tibble: 336,776 × 19#> # Groups: year, month, day [365]#> year month day dep_time sched_dep_time#> <int> <int> <int> <int> <int>#> 1 2013 1 1 517 515#> 2 2013 1 1 533 529#> 3 2013 1 1 542 540#> # ℹ 336,773 more rows#> # ℹ 14 more variables: dep_delay <dbl>,#> # arr_time <int>, sched_arr_time <int>,#> # arr_delay <dbl>, carrier <chr>,#> # flight <int>, tailnum <chr>,#> # origin <chr>, dest <chr>,#> # air_time <dbl>, distance <dbl>, …获取分组元数据的相关函数
by_day %>% group_vars()#> [1] "year" "month" "day"by_day %>% group_data()#> # A tibble: 365 × 4#> year month day .rows#> <int> <int> <int> <list<int>>#> 1 2013 1 1 [842]#> 2 2013 1 2 [943]#> 3 2013 1 3 [914]#> # ℹ 362 more rows# group_keys() / # group_rows() / group_indices()# group_size() / n_groups()>> 分组处理:group_by() 👉 vignette("grouping")
# 分组汇总# 返回结果默认情况下会去除最低一级分组,# 并有相应的提示信息,除非设定参数 # .groups = 'keep'summarize( by_day, mean_delay = mean( dep_delay, na.rm = TRUE ))#> `summarise()` has grouped output by#> 'year', 'month'. You can override using#> the `.groups` argument.#> # A tibble: 365 × 4#> # Groups: year, month [12]#> year month day mean_delay#> <int> <int> <int> <dbl>#> 1 2013 1 1 11.5#> 2 2013 1 2 13.9#> 3 2013 1 3 11.0#> # ℹ 362 more rows>> 分组处理:group_by() 👉 vignette("grouping")
# 分组汇总# 返回结果默认情况下会去除最低一级分组,# 并有相应的提示信息,除非设定参数 # .groups = 'keep'summarize( by_day, mean_delay = mean( dep_delay, na.rm = TRUE ))#> `summarise()` has grouped output by#> 'year', 'month'. You can override using#> the `.groups` argument.#> # A tibble: 365 × 4#> # Groups: year, month [12]#> year month day mean_delay#> <int> <int> <int> <dbl>#> 1 2013 1 1 11.5#> 2 2013 1 2 13.9#> 3 2013 1 3 11.0#> # ℹ 362 more rows# 假如你觉得 group_by() + summarize()# 不够强大,你还可以使用实验性的 # purrr-style 函数,如 group_map()/# *_modify()/*_walk() 等group_modify( by_day, ~ broom::tidy( # what's this?! lm(arr_delay ~ dep_delay, data=.x) ))#> # A tibble: 730 × 8#> # Groups: year, month, day [365]#> year month day term estimate#> <int> <int> <int> <chr> <dbl>#> 1 2013 1 1 (Intercept) 0.910#> 2 2013 1 1 dep_delay 1.03 #> 3 2013 1 2 (Intercept) -1.32 #> # ℹ 727 more rows#> # ℹ 3 more variables: std.error <dbl>,#> # statistic <dbl>, p.value <dbl>>> 分组处理:.by / by 参数 👉 ?dplyr_by
group_by()对数据框的分组设定会影响后续 dplyr 包函数的处理方式与结果,特别是summarize()、reframe()、mutate()、filter()、slice*()等;如果你不需要基于分组进行后续操作,需先用ungroup(x, ...)函数来取消对数据集x(基于指定变量...)的分组设定
- dplyrv1.1.0 新增了实验性分组参数
.by / by,只对.data进行一次性的临时分组(且不保留分组结构)
summarize( group_by(flights, year, month, day), mean_delay = mean( dep_delay, na.rm = TRUE ))#> # A tibble: 365 × 4#> # Groups: year, month [12]#> year month day mean_delay#> <int> <int> <int> <dbl>#> 1 2013 1 1 11.5#> 2 2013 1 2 13.9#> 3 2013 1 3 11.0#> # ℹ 362 more rowssummarize( flights, mean_delay = mean( dep_delay, na.rm = TRUE ), .by = c(year, month, day))#> # A tibble: 365 × 4#> year month day mean_delay#> <int> <int> <int> <dbl>#> 1 2013 1 1 11.5#> 2 2013 1 2 13.9#> 3 2013 1 3 11.0#> # ℹ 362 more rows---------------------|------------------------------------ Grouping only affects a single verb | Grouping is persistent across multiple verbs Selects variables with tidy-select | Computes expressions with data-masking Summaries use existing order of group keys | Summaries sort group keys in ascending order
- To prevent surprising results, you can't use
.byon an existing grouped data frame.
- https://github.com/tidyverse/dplyr/releases/tag/v1.1.0
- The most useful reason to do this is because
.byonly affects a single operation. In the example above, an ungrouped data frame went into thesummarize()call, so an ungrouped data frame will come out; with.by, you never need to remember toungroup()afterwards and you never need to use the.groupsargument. - Additionally, using
summarize()with.bywill never sort the results by the group key, unlike withgroup_by(). Instead, the results are returned using the existing ordering of the groups from the original data. We feel this is more predictable, better maintains any ordering you might have already applied with a previous call toarrange(), and provides a way to maintain the current ordering without having to resort to factors. - This feature was inspired by
data.table, where the equivalent syntax looks like:starwars[, .(mean_height = mean(height)), by = .(species, homeworld)] with_groups()is superseded in favor of.by(#6582).
- The most useful reason to do this is because
>> 行式处理:rowwise()
rowwise(data, ...)允许你对数据框的每一行进行运算,当不存在相应的向量化函数时,进行逐行式运算可以让你避免编写显性循环的代码- 和
group_by()类似,rowwise()并不更改数据框的结构,而是让后续的 dplyr 函数操作按逐行式进行 rowwise()返回的是一种特殊的行分组数据框(rowwise_df,每行一组),绝大多数的 dplyr 函数会保留数据框的行分组信息(返回grouped_df的summarize()函数是个例外);你可以通过ungroup()或as_tibble()函数来取消行分组,或通过group_by()函数转变为grouped_df
flights_rw <- rowwise(flights_sml)class(flights_rw)#> [1] "rowwise_df" "tbl_df" "tbl" #> [4] "data.frame"flights_rw#> # A tibble: 336,776 × 6#> # Rowwise: #> year month day dep_delay arr_delay air_time#> <int> <int> <int> <dbl> <dbl> <dbl>#> 1 2013 1 1 2 11 227#> 2 2013 1 1 4 20 227#> 3 2013 1 1 2 33 160#> # ℹ 336,773 more rows>> 行式处理:rowwise()
rowwise(data, ...)允许你对数据框的每一行进行运算,当不存在相应的向量化函数时,进行逐行式运算可以让你避免编写显性循环的代码- 和
group_by()类似,rowwise()并不更改数据框的结构,而是让后续的 dplyr 函数操作按逐行式进行 rowwise()返回的是一种特殊的行分组数据框(rowwise_df,每行一组),绝大多数的 dplyr 函数会保留数据框的行分组信息(返回grouped_df的summarize()函数是个例外);你可以通过ungroup()或as_tibble()函数来取消行分组,或通过group_by()函数转变为grouped_df
flights_rw <- rowwise(flights_sml)class(flights_rw)#> [1] "rowwise_df" "tbl_df" "tbl" #> [4] "data.frame"flights_rw#> # A tibble: 336,776 × 6#> # Rowwise: #> year month day dep_delay arr_delay air_time#> <int> <int> <int> <dbl> <dbl> <dbl>#> 1 2013 1 1 2 11 227#> 2 2013 1 1 4 20 227#> 3 2013 1 1 2 33 160#> # ℹ 336,773 more rows# long time to runmutate( flights_rw, max_delay = max(c_across(ends_with("_delay"))))#> # A tibble: 336,776 × 7#> # Rowwise: #> year month day dep_delay arr_delay#> <int> <int> <int> <dbl> <dbl>#> 1 2013 1 1 2 11#> 2 2013 1 1 4 20#> 3 2013 1 1 2 33#> # ℹ 336,773 more rows#> # ℹ 2 more variables: air_time <dbl>,#> # max_delay <dbl>>> 行式处理:rowwise()
一个稍微复杂(但思路类似的)例子
nest_flights <- nest_by( flights_sml, year, month, day)nest_flights#> # A tibble: 365 × 4#> # Rowwise: year, month, day#> year month day data#> <int> <int> <int> <list<tibble[,3]>>#> 1 2013 1 1 [842 × 3]#> 2 2013 1 2 [943 × 3]#> 3 2013 1 3 [914 × 3]#> 4 2013 1 4 [915 × 3]#> 5 2013 1 5 [720 × 3]#> # ℹ 360 more rows>> 行式处理:rowwise()
一个稍微复杂(但思路类似的)例子
nest_flights <- nest_by( flights_sml, year, month, day)nest_flights#> # A tibble: 365 × 4#> # Rowwise: year, month, day#> year month day data#> <int> <int> <int> <list<tibble[,3]>>#> 1 2013 1 1 [842 × 3]#> 2 2013 1 2 [943 × 3]#> 3 2013 1 3 [914 × 3]#> 4 2013 1 4 [915 × 3]#> 5 2013 1 5 [720 × 3]#> # ℹ 360 more rowsmutate( nest_flights, mean_delay = mean( data$dep_delay, na.rm = TRUE ), .keep = "none")#> # A tibble: 365 × 4#> # Rowwise: year, month, day#> year month day mean_delay#> <int> <int> <int> <dbl>#> 1 2013 1 1 11.5 #> 2 2013 1 2 13.9 #> 3 2013 1 3 11.0 #> 4 2013 1 4 8.95#> 5 2013 1 5 5.73#> # ℹ 360 more rows>> 行式处理:rowwise()
一个稍微复杂(但思路类似的)例子
nest_flights <- nest_by( flights_sml, year, month, day)nest_flights#> # A tibble: 365 × 4#> # Rowwise: year, month, day#> year month day data#> <int> <int> <int> <list<tibble[,3]>>#> 1 2013 1 1 [842 × 3]#> 2 2013 1 2 [943 × 3]#> 3 2013 1 3 [914 × 3]#> 4 2013 1 4 [915 × 3]#> 5 2013 1 5 [720 × 3]#> # ℹ 360 more rowsmutate( nest_flights, mean_delay = mean( data$dep_delay, na.rm = TRUE ), .keep = "none")#> # A tibble: 365 × 4#> # Rowwise: year, month, day#> year month day mean_delay#> <int> <int> <int> <dbl>#> 1 2013 1 1 11.5 #> 2 2013 1 2 13.9 #> 3 2013 1 3 11.0 #> 4 2013 1 4 8.95#> 5 2013 1 5 5.73#> # ℹ 360 more rows👉 vignette("rowwise")
5. 用 %>% 连接多个操作
(chaining multiple operations with the pipe %>%)
>> 管道运算符:%>%
不用 %>% 的代码
by_dest <- group_by(flights, dest)delay <- summarize( by_dest, count = n(), dist = mean(distance, na.rm = TRUE), delay = mean(arr_delay, na.rm = TRUE))delay <- filter(delay, count > 20, dest != "HNL")ggplot(delay, aes(x = dist, y = delay)) + geom_point(aes(size = count), alpha = 1/3) + geom_smooth(se = FALSE)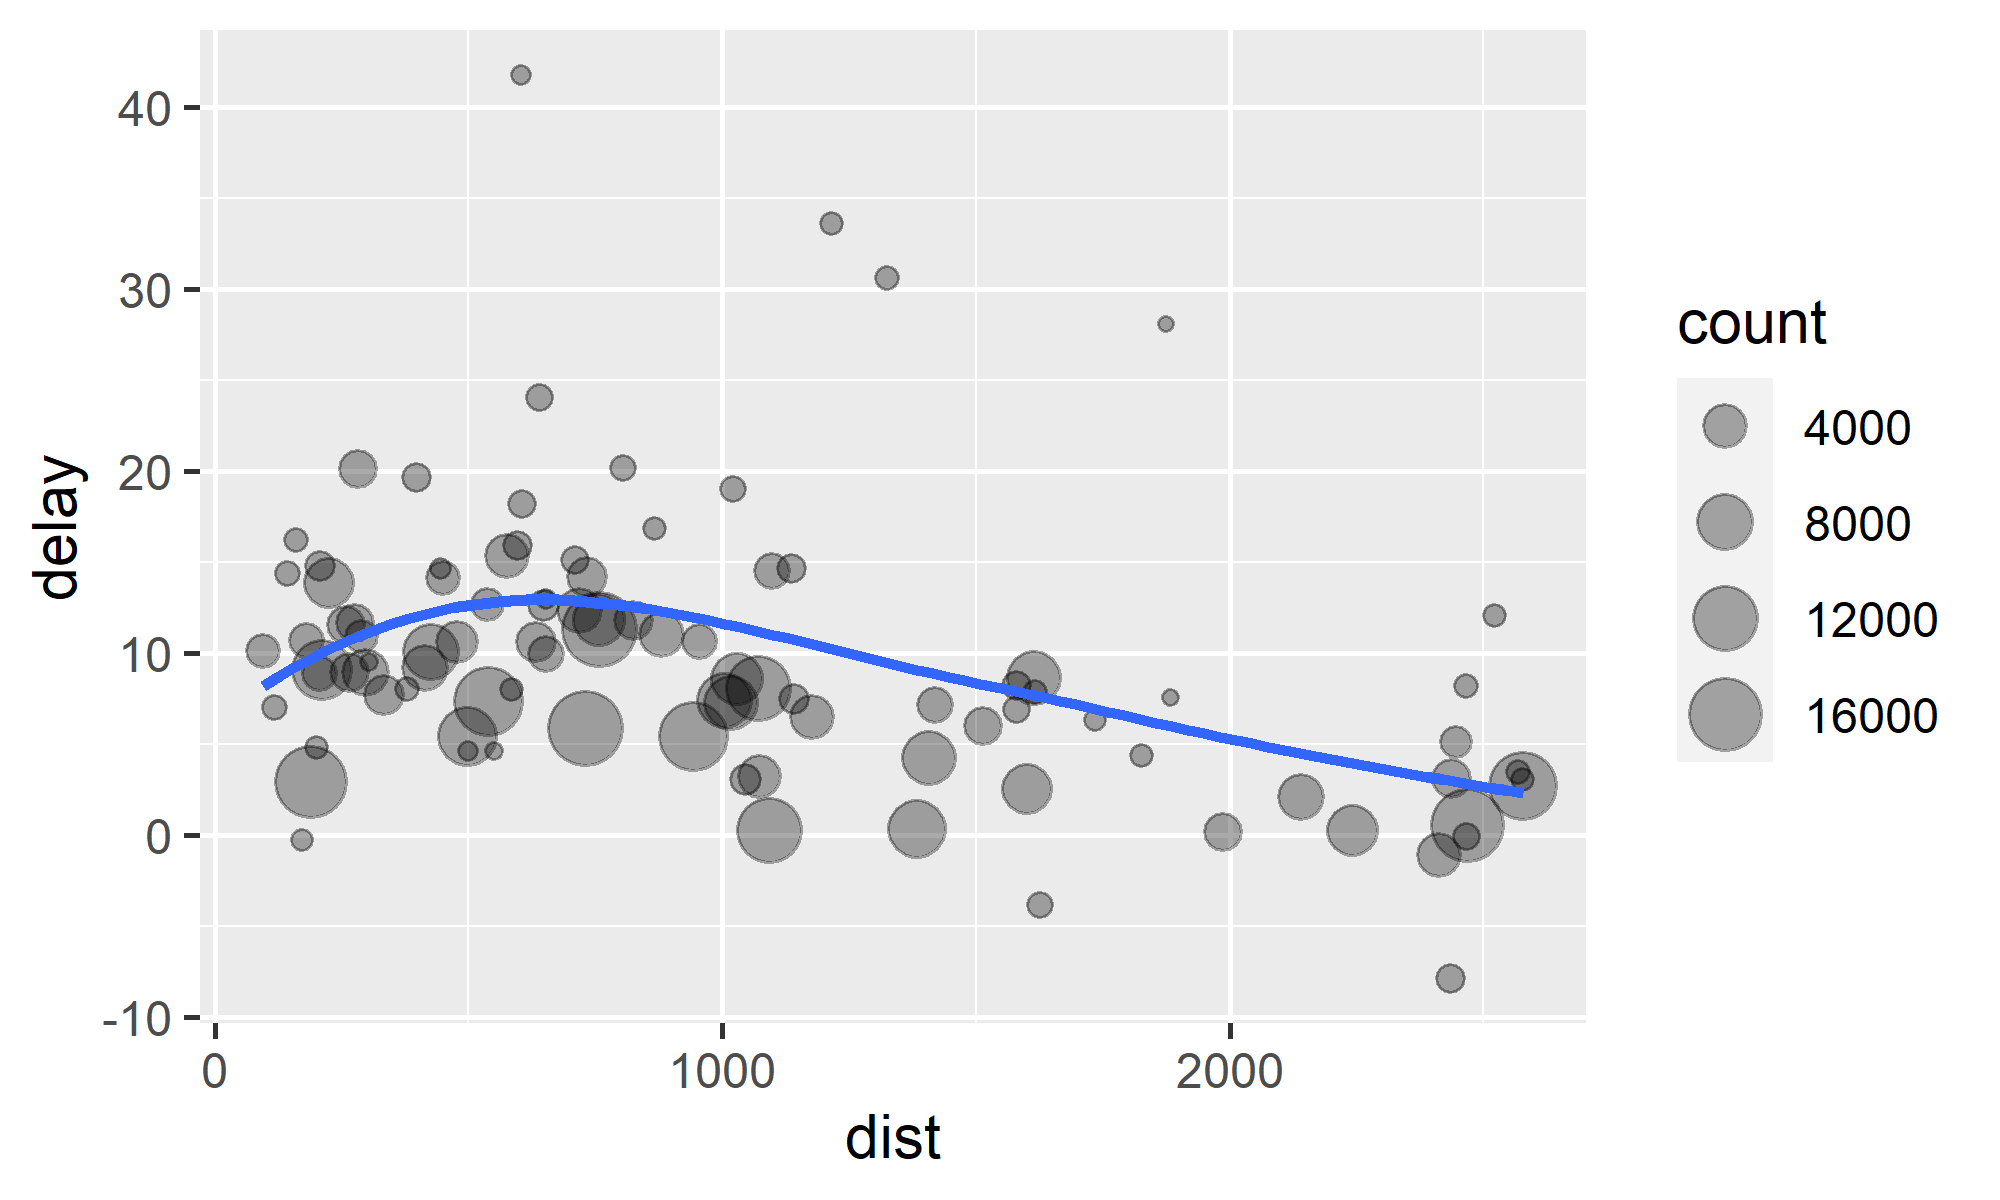
>> 管道运算符:%>%
使用 %>% 的代码( %>% 来自 magrittr 包,快捷键为 Ctrl+Shift+M )
# 用 %>% 改写前一页的代码flights %>% group_by(dest) %>% summarize( count = n(), dist = mean(distance, na.rm = TRUE), delay = mean(arr_delay, na.rm = TRUE) ) %>% filter(count > 20, dest != "HNL") %>% ggplot(aes(x = dist, y = delay)) + geom_point(aes(size = count), alpha = 1/3) + geom_smooth(se = FALSE)>> 管道运算符:%>%
使用 %>% 的代码( %>% 来自 magrittr 包,快捷键为 Ctrl+Shift+M )
# 用 %>% 改写前一页的代码flights %>% group_by(dest) %>% summarize( count = n(), dist = mean(distance, na.rm = TRUE), delay = mean(arr_delay, na.rm = TRUE) ) %>% filter(count > 20, dest != "HNL") %>% ggplot(aes(x = dist, y = delay)) + geom_point(aes(size = count), alpha = 1/3) + geom_smooth(se = FALSE)让函数兼容管道操作符有助于实现
tidyverse的{{核心原则}}使用
%>%编写的代码关注动词(如数据变换操作)而非名词(操作对象),这使得代码更容易写,更容易读,也更容易修改dplyr包的函数具备这样的特性:f(.data01, ...) -> .data02,“数据进,数据出”,更适用于管道操作dplyr包会在后台自动将x %>% f(y)转变为f(x, y),将x %>% f(y, .)转变为f(y, x),将x %>% f(y, z = .)转变为f(y, z = x)……
>> 管道运算符:%>%
yet again but with R's native forward pipe operator |>
not_cancelled <- flights |> filter(!is.na(dep_delay), !is.na(arr_delay))not_cancelled |> group_by(year, month, day) |> summarize( first = dep_time |> min(), last = dep_time %>% max, avg_delay1 = mean(arr_delay), avg_delay2 = mean(arr_delay[arr_delay > 0]) # average pos delay )#> # A tibble: 365 × 7#> # Groups: year, month [12]#> year month day first last avg_delay1 avg_delay2#> <int> <int> <int> <int> <int> <dbl> <dbl>#> 1 2013 1 1 517 2356 12.7 32.5#> 2 2013 1 2 42 2354 12.7 32.0#> 3 2013 1 3 32 2349 5.73 27.7#> # ℹ 362 more rows🙋♂️ Your Turn!
05:00
利用管道操作符 %>% 改写以下 # 重嵌套的代码:
summarize( select( group_by(starwars, species, sex), height, mass ), height = mean(height, na.rm = TRUE), mass = mean(mass, na.rm = TRUE))#> # A tibble: 41 × 4#> # Groups: species [38]#> species sex height mass#> <chr> <chr> <dbl> <dbl>#> 1 Aleena male 79 15#> 2 Besalisk male 198 102#> 3 Cerean male 198 82#> # ℹ 38 more rowsstarwars %>% group_by(species, sex) %>% select(height, mass) %>% summarize( height = mean(height, na.rm = TRUE), mass = mean(mass, na.rm = TRUE) )#> # A tibble: 41 × 4#> # Groups: species [38]#> species sex height mass#> <chr> <chr> <dbl> <dbl>#> 1 Aleena male 79 15#> 2 Besalisk male 198 102#> 3 Cerean male 198 82#> # ℹ 38 more rows课后复习
🕐 复习 📖 {{R for Data Science, 2e}} 一书第一部分 Whole game 中关于数据处理的章节,即 4 Data transformation 并(结队)完成课后练习
👉 课后习题参考答案链接
{{R for Data Science (2e): Solutions to Exercises}}
🕑 下载(打印) 📰 {{dplyr的cheatsheet}} 并阅读之
🕒 browseVignettes(package = "dplyr") 📝,阅读:
6. 合并数据集
(combine tables)
airlines#> # A tibble: 16 × 2#> carrier name #> <chr> <chr> #> 1 9E Endeavor Air Inc. #> 2 AA American Airlines Inc.#> 3 AS Alaska Airlines Inc. #> # ℹ 13 more rowsplanes#> # A tibble: 3,322 × 9#> tailnum year type manufacturer model#> <chr> <int> <chr> <chr> <chr>#> 1 N10156 2004 Fixed win… EMBRAER EMB-…#> 2 N102UW 1998 Fixed win… AIRBUS INDU… A320…#> 3 N103US 1999 Fixed win… AIRBUS INDU… A320…#> # ℹ 3,319 more rows#> # ℹ 4 more variables: engines <int>,#> # seats <int>, speed <int>, engine <chr>airlines#> # A tibble: 16 × 2#> carrier name #> <chr> <chr> #> 1 9E Endeavor Air Inc. #> 2 AA American Airlines Inc.#> 3 AS Alaska Airlines Inc. #> # ℹ 13 more rowsplanes#> # A tibble: 3,322 × 9#> tailnum year type manufacturer model#> <chr> <int> <chr> <chr> <chr>#> 1 N10156 2004 Fixed win… EMBRAER EMB-…#> 2 N102UW 1998 Fixed win… AIRBUS INDU… A320…#> 3 N103US 1999 Fixed win… AIRBUS INDU… A320…#> # ℹ 3,319 more rows#> # ℹ 4 more variables: engines <int>,#> # seats <int>, speed <int>, engine <chr>airports#> # A tibble: 1,458 × 8#> faa name lat lon alt tz dst #> <chr> <chr> <dbl> <dbl> <dbl> <dbl> <chr>#> 1 04G Lansdo… 41.1 -80.6 1044 -5 A #> 2 06A Moton … 32.5 -85.7 264 -6 A #> 3 06C Schaum… 42.0 -88.1 801 -6 A #> # ℹ 1,455 more rows#> # ℹ 1 more variable: tzone <chr>weather#> # A tibble: 26,115 × 15#> origin year month day hour temp dewp#> <chr> <int> <int> <int> <int> <dbl> <dbl>#> 1 EWR 2013 1 1 1 39.0 26.1#> 2 EWR 2013 1 1 2 39.0 27.0#> 3 EWR 2013 1 1 3 39.0 28.0#> # ℹ 26,112 more rows#> # ℹ 8 more variables: humid <dbl>,#> # wind_dir <dbl>, wind_speed <dbl>,#> # wind_gust <dbl>, precip <dbl>,#> # pressure <dbl>, visib <dbl>,#> # time_hour <dttm>>> 键(keys)
主键(primary key):指的是数据表中一个变量(列)或多个变量的组合,其值能唯一地标识表中的每一行。主键主要用来与其他表的外键关联,以及本表的修改与删除。
planes %>% count(tailnum) %>% filter(n > 1)#> # A tibble: 0 × 2#> # ℹ 2 variables: tailnum <chr>, n <int>weather %>% count(year, month, day, hour, origin) %>% filter(n > 1)#> # A tibble: 3 × 6#> year month day hour origin n#> <int> <int> <int> <int> <chr> <int>#> 1 2013 11 3 1 EWR 2#> 2 2013 11 3 1 JFK 2#> 3 2013 11 3 1 LGA 2weather <- weather %>% distinct(year, month, day, hour, origin, .keep_all = TRUE) # 修正之>> 键(keys)
主键(primary key):指的是数据表中一个变量(列)或多个变量的组合,其值能唯一地标识表中的每一行。主键主要用来与其他表的外键关联,以及本表的修改与删除。
planes %>% count(tailnum) %>% filter(n > 1)#> # A tibble: 0 × 2#> # ℹ 2 variables: tailnum <chr>, n <int>weather %>% count(year, month, day, hour, origin) %>% filter(n > 1)#> # A tibble: 3 × 6#> year month day hour origin n#> <int> <int> <int> <int> <chr> <int>#> 1 2013 11 3 1 EWR 2#> 2 2013 11 3 1 JFK 2#> 3 2013 11 3 1 LGA 2weather <- weather %>% distinct(year, month, day, hour, origin, .keep_all = TRUE) # 修正之外键(foreign key):对应于另一数据表主键的一个或多个变量。

>> 合并式连接(mutating joins)
*_join(x, y, by = NULL, copy = FALSE, suffix = c(".x", ".y"), ...)
flights %>% select(year:day, hour, tailnum, carrier) %>% left_join(airlines) # 以同名变量为合并键,增加变量 name(航空公司全名)#> Joining with `by = join_by(carrier)`#> # A tibble: 336,776 × 7#> year month day hour tailnum carrier name #> <int> <int> <int> <dbl> <chr> <chr> <chr> #> 1 2013 1 1 5 N14228 UA United Air Lines Inc. #> 2 2013 1 1 5 N24211 UA United Air Lines Inc. #> 3 2013 1 1 5 N619AA AA American Airlines Inc.#> # ℹ 336,773 more rows>> 合并式连接(mutating joins)
*_join(x, y, by = NULL, copy = FALSE, suffix = c(".x", ".y"), ...)
flights %>% select(year:day, hour, tailnum, carrier) %>% left_join(airlines) # 以同名变量为合并键,增加变量 name(航空公司全名)#> Joining with `by = join_by(carrier)`#> # A tibble: 336,776 × 7#> year month day hour tailnum carrier name #> <int> <int> <int> <dbl> <chr> <chr> <chr> #> 1 2013 1 1 5 N14228 UA United Air Lines Inc. #> 2 2013 1 1 5 N24211 UA United Air Lines Inc. #> 3 2013 1 1 5 N619AA AA American Airlines Inc.#> # ℹ 336,773 more rowsflights %>% select(year:day, hour, tailnum, carrier) %>% mutate(name = airlines$name[match(carrier, airlines$carrier)]) # 殊途同归,但容易理解吗?#> # A tibble: 336,776 × 7#> year month day hour tailnum carrier name #> <int> <int> <int> <dbl> <chr> <chr> <chr> #> 1 2013 1 1 5 N14228 UA United Air Lines Inc. #> 2 2013 1 1 5 N24211 UA United Air Lines Inc. #> 3 2013 1 1 5 N619AA AA American Airlines Inc.#> # ℹ 336,773 more rows

>> 合并式连接(mutating joins)
用 by 参数设定连接所用的键变量
# 默认时(即`by = NULL`)使用两个数据集中同名的全部变量,即natural join# 此时会显示提示信息“Joining, by = join_by(以,分隔的全部同名变量)”flights %>% left_join(weather)# 显性设定`by = join_by(以,分隔的键变量)` 或者 `by = 键变量字符向量`flights %>% left_join(weather, by = join_by(year, month, day, origin, hour))# 两个数据集的变量不同名时,则显性设定如# `by = join_by(xv1 == yv1, xv2 == yv2)` 或者 `by = 命名字符变量向量`flights %>% left_join(airports, by = join_by(dest == faa)) # by = c("dest" = "faa")# dplyr v1.1.0 `by` 参数设定的新语法 `by = join_by(...)` 更加灵活,支持非等值# 连接(non-equi joins)(具体见后)>> 合并式连接(mutating joins)
合并式连接函数*_join()的参数 relationship 1,3
"one-to-one"
[见前]"one-to-many"/"many-to-one"

"many-to-many"2

- 为 dplyrv1.1.1 的新增参数。
- 通常来说,对两个数据集进行
many-to-many的等值合并(equi join)并不合理,*_join()函数在relationship参数取默认值NULL时会给出相应的警告信息。 *_join()函数的其他参数:keep、na_matches、multiple和unmatched。
>> 筛选式连接(filtering joins)
semi_join(x, y, by = NULL, copy = FALSE, ...) | anti_join()
保留 | 丢弃 x 数据集中在 y 数据集中找得到匹配的样本
top_dest <- flights %>% count(dest, sort = TRUE) %>% head(10)flights %>% filter(dest %in% top_dest$dest)#> # A tibble: 141,145 × 19#> year month day dep_time sched_dep_time dep_delay arr_time sched_arr_time arr_delay#> <int> <int> <int> <int> <int> <dbl> <int> <int> <dbl>#> 1 2013 1 1 542 540 2 923 850 33#> 2 2013 1 1 554 600 -6 812 837 -25#> 3 2013 1 1 554 558 -4 740 728 12#> # ℹ 141,142 more rows#> # ℹ 10 more variables: carrier <chr>, flight <int>, tailnum <chr>, origin <chr>,#> # dest <chr>, air_time <dbl>, distance <dbl>, hour <dbl>, minute <dbl>,#> # time_hour <dttm>>> 筛选式连接(filtering joins)
semi_join(x, y, by = NULL, copy = FALSE, ...) | anti_join()
保留 | 丢弃 x 数据集中在 y 数据集中找得到匹配的样本
top_dest <- flights %>% count(dest, sort = TRUE) %>% head(10)flights %>% filter(dest %in% top_dest$dest)#> # A tibble: 141,145 × 19#> year month day dep_time sched_dep_time dep_delay arr_time sched_arr_time arr_delay#> <int> <int> <int> <int> <int> <dbl> <int> <int> <dbl>#> 1 2013 1 1 542 540 2 923 850 33#> 2 2013 1 1 554 600 -6 812 837 -25#> 3 2013 1 1 554 558 -4 740 728 12#> # ℹ 141,142 more rows#> # ℹ 10 more variables: carrier <chr>, flight <int>, tailnum <chr>, origin <chr>,#> # dest <chr>, air_time <dbl>, distance <dbl>, hour <dbl>, minute <dbl>,#> # time_hour <dttm>flights %>% semi_join(top_dest)# 相同的结果,但更容易处理 filter() + %in% 所难以处理的存在多个 key 变量的情况>> 非等值连接(non-equi joins)
# # input data by hand# transactions <- tibble(# company = c("A", "A", "B", "B"),# year = c(2019, 2020, 2021, 2023),# revenue = c(50, 4, 10, 12)# )transactions#> # A tibble: 4 × 3#> company year revenue#> <chr> <dbl> <dbl>#> 1 A 2019 50#> 2 A 2020 4#> 3 B 2021 10#> 4 B 2023 12companies#> # A tibble: 3 × 3#> id since name #> <chr> <dbl> <chr> #> 1 A 1973 Patagonia#> 2 B 2009 RStudio #> 3 B 2022 Posit>> 非等值连接(non-equi joins)
# # input data by hand# transactions <- tibble(# company = c("A", "A", "B", "B"),# year = c(2019, 2020, 2021, 2023),# revenue = c(50, 4, 10, 12)# )transactions#> # A tibble: 4 × 3#> company year revenue#> <chr> <dbl> <dbl>#> 1 A 2019 50#> 2 A 2020 4#> 3 B 2021 10#> 4 B 2023 12companies#> # A tibble: 3 × 3#> id since name #> <chr> <dbl> <chr> #> 1 A 1973 Patagonia#> 2 B 2009 RStudio #> 3 B 2022 Posit# 1. Equality Joins:transactions |> left_join(companies, by = join_by(company == id))#> Warning in left_join(transactions, companies, by = join_by(company == id)): Detected an unexpected many-to-many#> relationship between `x` and `y`.#> ℹ Row 3 of `x` matches multiple rows in `y`.#> ℹ Row 1 of `y` matches multiple rows in `x`.#> ℹ If a many-to-many relationship is#> expected, set `relationship =#> "many-to-many"` to silence this warning.#> # A tibble: 6 × 5#> company year revenue since name #> <chr> <dbl> <dbl> <dbl> <chr> #> 1 A 2019 50 1973 Patagonia#> 2 A 2020 4 1973 Patagonia#> 3 B 2021 10 2009 RStudio #> 4 B 2021 10 2022 Posit #> 5 B 2023 12 2009 RStudio #> 6 B 2023 12 2022 Posit🤔 如何解决?
>> 非等值连接(non-equi joins)
# 2. Inequality Joins: # involves at least one join expression# containing one of inequality # conditions: >=, >, <=, or <.transactions |> left_join(companies, join_by(company == id, year >= since))#> # A tibble: 5 × 5#> company year revenue since name #> <chr> <dbl> <dbl> <dbl> <chr> #> 1 A 2019 50 1973 Patagonia#> 2 A 2020 4 1973 Patagonia#> 3 B 2021 10 2009 RStudio #> 4 B 2023 12 2009 RStudio #> 5 B 2023 12 2022 Posit>> 非等值连接(non-equi joins)
# 2. Inequality Joins: # involves at least one join expression# containing one of inequality # conditions: >=, >, <=, or <.transactions |> left_join(companies, join_by(company == id, year >= since))#> # A tibble: 5 × 5#> company year revenue since name #> <chr> <dbl> <dbl> <dbl> <chr> #> 1 A 2019 50 1973 Patagonia#> 2 A 2020 4 1973 Patagonia#> 3 B 2021 10 2009 RStudio #> 4 B 2023 12 2009 RStudio #> 5 B 2023 12 2022 Posit# 3. Rolling Joins: transactions |> left_join(companies, join_by(company == id, closest(year >= since)))#> # A tibble: 4 × 5#> company year revenue since name #> <chr> <dbl> <dbl> <dbl> <chr> #> 1 A 2019 50 1973 Patagonia#> 2 A 2020 4 1973 Patagonia#> 3 B 2021 10 2009 RStudio #> 4 B 2023 12 2022 Posit# 4. Overlap Joins:# three helpers for overlap joins: # between(), overlaps(), and within()>> 非等值连接(non-equi joins)
# 2. Inequality Joins: # involves at least one join expression# containing one of inequality # conditions: >=, >, <=, or <.transactions |> left_join(companies, join_by(company == id, year >= since))#> # A tibble: 5 × 5#> company year revenue since name #> <chr> <dbl> <dbl> <dbl> <chr> #> 1 A 2019 50 1973 Patagonia#> 2 A 2020 4 1973 Patagonia#> 3 B 2021 10 2009 RStudio #> 4 B 2023 12 2009 RStudio #> 5 B 2023 12 2022 Posit# 3. Rolling Joins: transactions |> left_join(companies, join_by(company == id, closest(year >= since)))#> # A tibble: 4 × 5#> company year revenue since name #> <chr> <dbl> <dbl> <dbl> <chr> #> 1 A 2019 50 1973 Patagonia#> 2 A 2020 4 1973 Patagonia#> 3 B 2021 10 2009 RStudio #> 4 B 2023 12 2022 Posit# 4. Overlap Joins:# three helpers for overlap joins: # between(), overlaps(), and within()
👉 ?join_by
>> 其它类型的合并
cross_join() / nest_join()
cross_join(x, y, ...)将数据集x中的每一行与数据集y中的每一行进行匹配,结果为nrow(x) * nrow(y)行nest_join(x, y, by = NULL, ...)保留数据集x,并将匹配的数据集y的数据作为新增的列表列,元素为tibble(当在数据集y中找不到匹配数据时,列表列相应位置填充一个0行的tibble)从某种意义上说,
cross_join()和nest_join()是最基础的数据集连接操作函数,例如left_join()可视为nest_join() + unnest(.keep_empty = TRUE),semi_join()可视为nest_join() + filter()(filter()用来检查列表列中元素是否为0行的tibble)
用 y 表中的数据来修改 x 表中的行
rows_insert(x, y, by = NULL, ...)|rows_update()|rows_upsert()rows_delete()rows_append()|rows_patch()
合并多个数据集的行或列
bind_rows(..., .id = NULL)
# do.call(rbind, dfs_list)bind_cols(..., .name_repair)
# do.call(cbind, dfs_list)
集合式合并
intersect(x, y, ...)setdiff(x, y, ...)|symdiff()union(x, y, ...)|union_all()
7. 操作数据库和 data.table
>> 连接并查询数据库
除了处理内存中以 tibble 或 data.frame 格式存在的数据集之外,dplyr 包还可用于处理存储在主流数据库中的数据,这主要适用于两种情形:
- 数据已经存储在数据库中
- 数据太大无法直接存入内存中,必须使用外部存储
这需要你额外安装 dbplyr 包2.3.4(会自动安装其需要载入的 DBI 包)以及你打算连接的不同数据库的接口 R 包(如 RPostgres、RMariaDB、odbc 等)。
以下我们以SQLite数据库为例说明。
准备工作
# install.packages("dbplyr")# install.packages("RSQLite")# library(dplyr)con <- DBI::dbConnect( RSQLite::SQLite(), dbname = ":memory:" )copy_to( con, nycflights13::flights, "flights", overwrite = TRUE, indexes = list( c("year", "month", "day"), "carrier", "tailnum", "dest"))>> 连接并查询数据库
# 创建对数据表的引用并列印结果(flights_db <- tbl(con, "flights"))#> # Source: table<flights> [?? x 19]#> # Database: sqlite 3.41.2 [:memory:]#> year month day dep_time sched_dep_time dep_delay arr_time sched_arr_time#> <int> <int> <int> <int> <int> <dbl> <int> <int>#> 1 2013 1 1 517 515 2 830 819#> 2 2013 1 1 533 529 4 850 830#> 3 2013 1 1 542 540 2 923 850#> # ℹ more rows#> # ℹ 11 more variables: arr_delay <dbl>, carrier <chr>, flight <int>,#> # tailnum <chr>, origin <chr>, dest <chr>, air_time <dbl>, distance <dbl>,#> # hour <dbl>, minute <dbl>, time_hour <dbl># 生成查询tailnum_delay_db <- flights_db %>% group_by(tailnum) %>% summarise( delay = mean(arr_delay), n = n() ) %>% arrange(desc(delay)) %>% filter(n > 100)>> 连接并查询数据库
tailnum_delay_db %>% show_query()#> <SQL>#> SELECT `tailnum`, AVG(`arr_delay`) AS `delay`, COUNT(*) AS `n`#> FROM `flights`#> GROUP BY `tailnum`#> HAVING (COUNT(*) > 100.0)#> ORDER BY `delay` DESCtailnum_delay <- tailnum_delay_db %>% collect()tailnum_delay#> # A tibble: 1,201 × 3#> tailnum delay n#> <chr> <dbl> <int>#> 1 N11119 30.3 148#> 2 N16919 29.9 251#> 3 N14998 27.9 230#> # ℹ 1,198 more rows>> 操作 data.table
data.table 是 data.table 包提供的一种数据结构,是升级版的 data.frame:
- 简洁的语法,
x[i, j, by] - 时间/内存高效的数据操作,如文件读取/输出、数据提取、汇总、更新、合并等
- 兼容只接受
data.frame数据格式的其它 R 包
dplyr 包允许你以 dplyr 的方式操作 data.table,后台的 dtplyr 包1.3.1会自动将其转译为等价的 data.table 语法。
# install.packages("dtplyr")library(dtplyr)# library(data.table)library(dplyr, warn.conflicts = FALSE)# 创建一个lazy data.table,追踪对其的操作flights_dt <- lazy_dt(nycflights13::flights)# 操作data.tableflights_dt %>% mutate(arr_delay = arr_delay/60) %>% group_by(tailnum) %>% summarize( across(ends_with("_delay"), mean), n = n() ) %>% arrange(desc(arr_delay)) %>% filter(n > 100)# Use as.data.table()/as.data.frame()/# as_tibble() to access results#> Source: local data table [1,201 x 4]#> Call: setorder(copy(`_DT1`)[, `:=`(arr_delay = arr_delay/60)][, .(dep_delay = mean(dep_delay), #> arr_delay = mean(arr_delay), n = .N), keyby = .(tailnum)], #> -arr_delay, na.last = TRUE)[n > 100]#> #> tailnum dep_delay arr_delay n#> <chr> <dbl> <dbl> <int>#> 1 N826UA 26.7 0.326 120#> 2 N929DL 25.3 0.293 108#> 3 N431UA 23.9 0.272 104#> 4 N342NW 21.1 0.267 111#> 5 N567UA 18.7 0.250 105#> 6 N850UA 23.9 0.248 130#> # ℹ 1,195 more rows#> #> # Use as.data.table()/as.data.frame()/as_tibble() to access results siuba: Python library for using dplyr like syntax with pandas and SQL
ibis: a lightweight, universal Python interface for data wrangling
课后复习
🕐 学习 📝 {{Markdown基础}} 和 {{Revealjs 演示文稿}},完善第4周的课后作业,并增加部分篇幅说明具体改进之处,于2023年10月26日22:00前将压缩包提交至 {{坚果云链接}}
🕑 复习 📖 {{R for Data Science, 2e}} 一书第三部分 Transform 中关于连接数据集的章节,即 20 Joins 并(结队)完成课后练习
👉
课后习题参考答案链接
{{R for Data Science (2e): Solutions to Exercises}}
{{R for Data Science: Exercise Solutions}}
🕒 下载(打印) 📰 {{dplyr的cheatsheet}} 并阅读之
🕓 browseVignettes(package = "dplyr") 📝,阅读: