>> shiny
shinyapp 是指和一台正运行着 R 会话(live R session)的计算机(即服务端 Server)相连的网页(即用户界面 UI)。
>> shiny
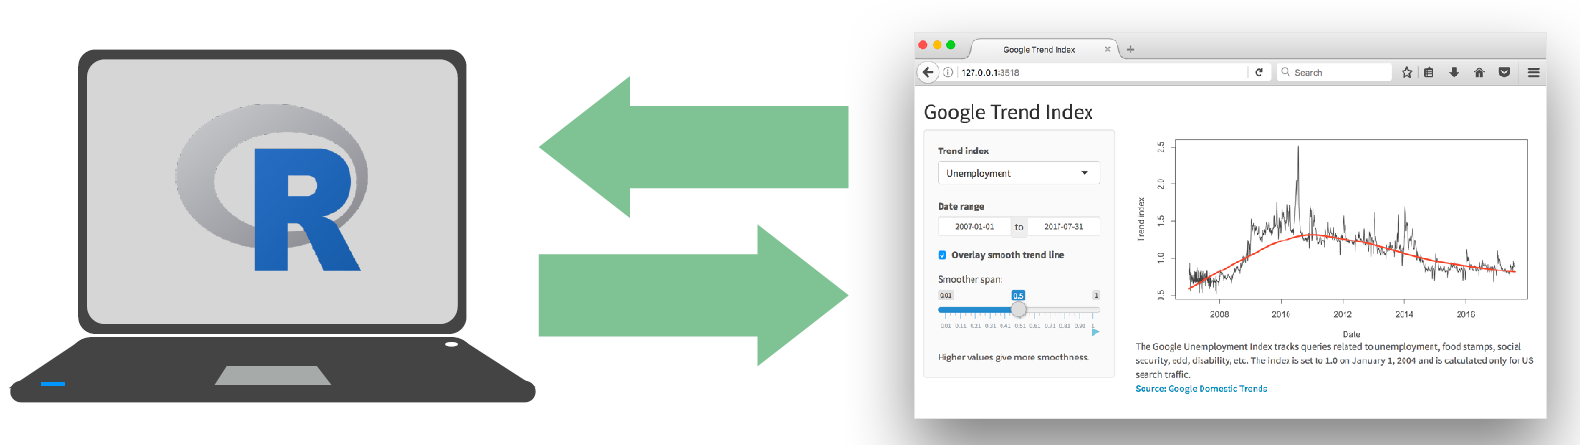
shinyapp 是指和一台正运行着 R 会话(live R session)的计算机(即服务端 Server)相连的网页(即用户界面 UI)。
>> shiny
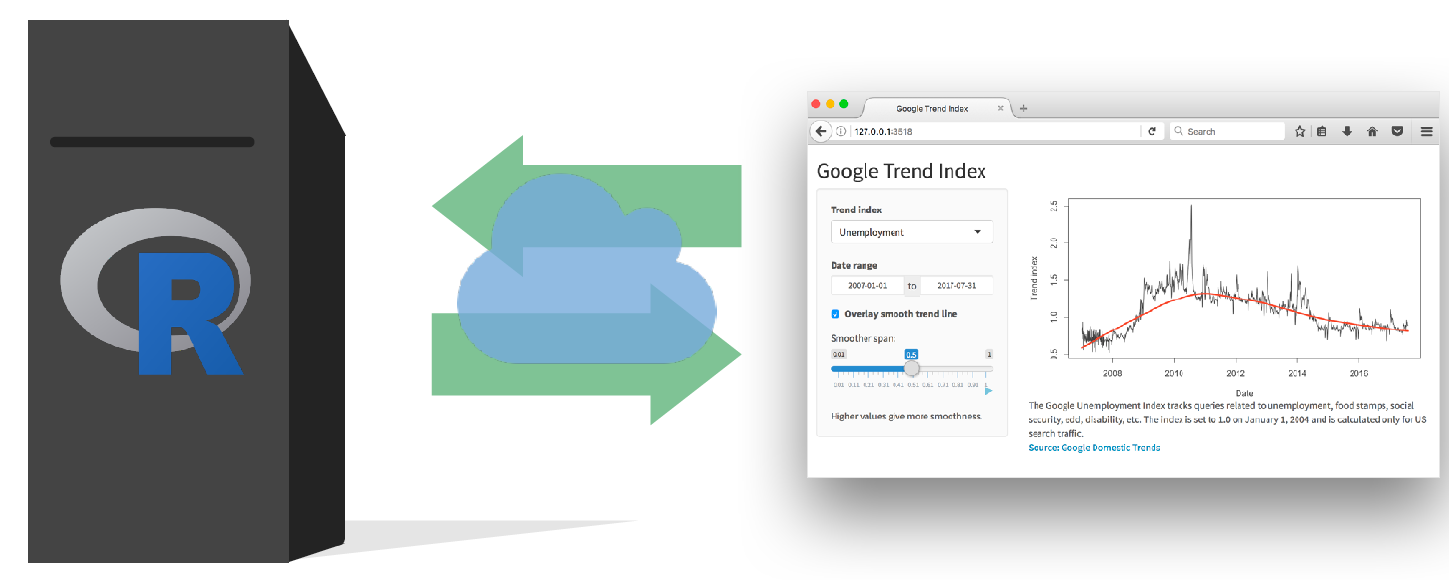
shinyapp 是指和一台正运行着 R 会话(live R session)的计算机(即服务端 Server)相连的网页(即用户界面 UI)。
- 用户直接在 UI 中操作,而 Server 根据要求运行 R 代码并更新 UI 内容。
>> shiny Basics
UI >> Inputs
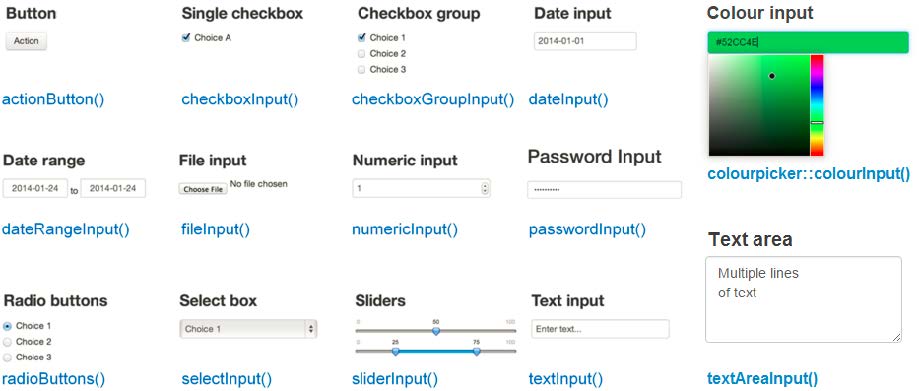
- 通过
inputfunc(inputId, label, ...)来收集用户的输入 - 通过
input$<inputId>获得响应式输入对象的当前取值
>> shiny Basics
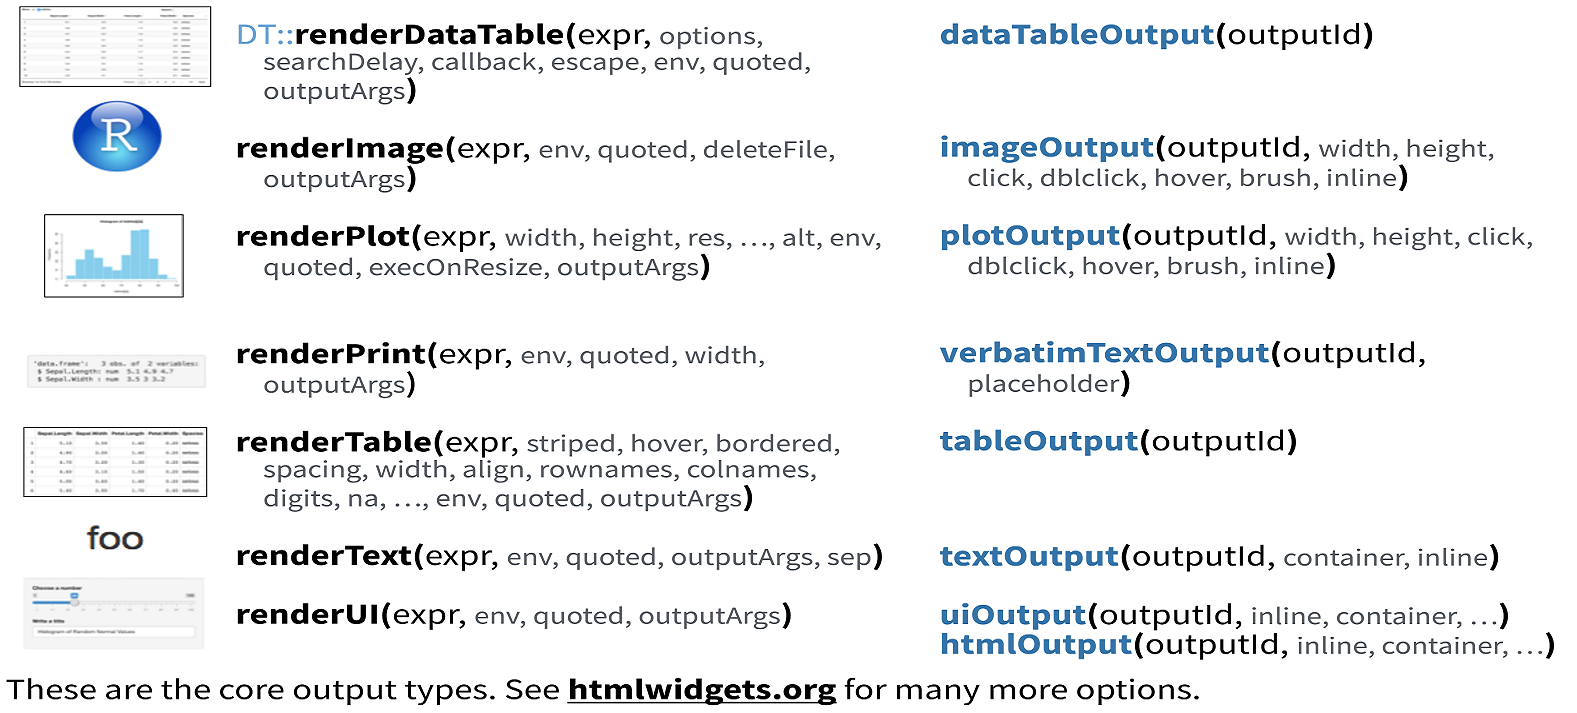
UI >> Outputs
- 前端
*Output()和 后台render*()👫 工作来给 UI 增加输出
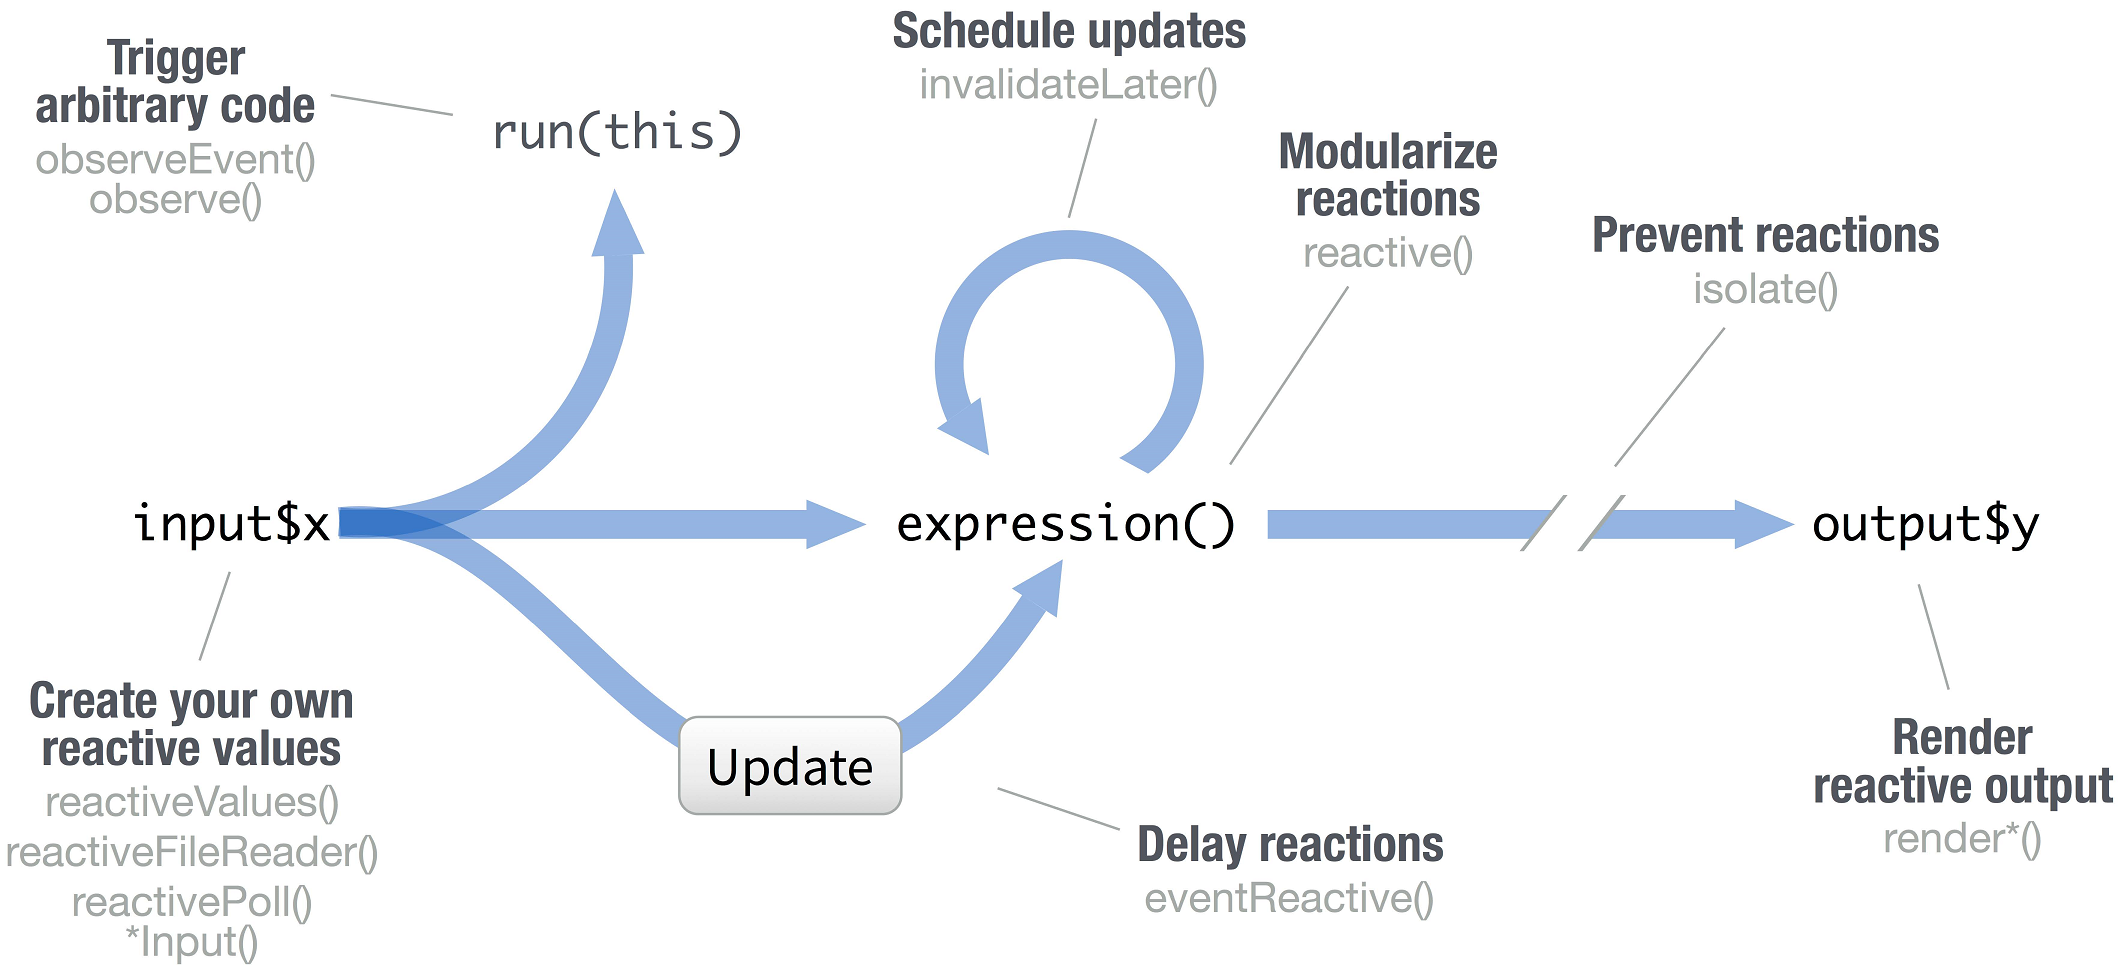
>> shiny Basics
reactivity
>> shiny Basics
shiny::runExample("01_hello")
* shiny::runExample() 列出内置的11个App示例,可尝试运行并查看代码。
>> shinydashboard Structure
shinydashboard 利用 {{AdminLTE}} * 提供的模板主题工具,这让使用 shiny 开发仪表盘式的网页 App 变得更加容易。
* Best open source admin dashboard & control panel theme. Built on top of Bootstrap, AdminLTE provides a range of responsive, reusable, and commonly used components.
>> shinydashboard Structure >> dashboardHeader()

ui <- dashboardPage( dashboardHeader( # 表头 title = "My awesome DashBoard", dropdownMenu( # 可重复多个 dropdownMenu() type = "messages", # "notifications" / "tasks" badgeStatus = "primary", icon = NULL, messageItem( # 可重复多个 messageItem() from, message, icon, time, href ), # ... ), # dropdownMenuOutput() # dynamic dropdown menu (UI-side) ), dashboardSidebar(), # 边栏 dashboardBody() # 主栏)>> shinydashboard Structure >> dashboardSidebar()
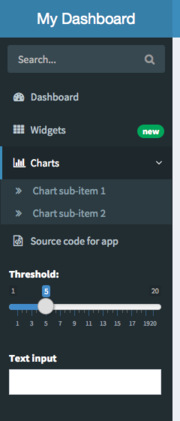
SIDEBAR <- dashboardSidebar( sidebarMenu( menuItem("Dashboard", tabName = "dashboard", icon = icon("dashboard")), menuItem("Widgets", icon = icon("th"), tabName = "widgets", badgeLabel = "new", badgeColor = "green") # menuItemOutput() # dynamic sidebar menu item (UI-side) ), # sidebarMenuOutput(), # dynamic sidebar menu (UI-side) # sidebarSearchForm(), sidebarUserPanel() sliderInput(inputId = "threshold", label = "Threshold", min = 1, max = 20, value = 5), # *Input())BODY <- dashboardBody( tabItems( tabItem(tabName = "dashboard", h2("Dashboard tab content")), tabItem(tabName = "widgets", h2("Widgets tab content")) ))dashboardPage(dashboardHeader(), SIDEBAR, BODY)>> shinydashboard Structure >> dashboardBody()
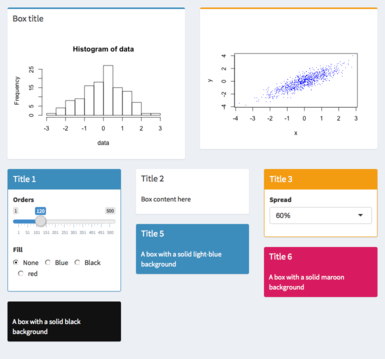
BODY <- dashboardBody( # mixed row and column layout fluidRow( box(title = "Box title", width = 6, status = "primary", "Box content"), box(status = "warning", width = 6, "Box content") ), fluidRow( column(width = 4, box( title = "Title 1", width = NULL, solidHeader = TRUE, status = "primary", "..." ), box( with = NULL, background = "black", "A box with a solid black background" ) ), # column(width = 4, box(...), box(...)), # column(width = 4, box(...), box(...)) ))# box() / tabBox(tabpanel()) / infoBox()/infoBoxOutput() / valueBox()/valueBoxOutput()
>> flexdashboard Template
layout codes
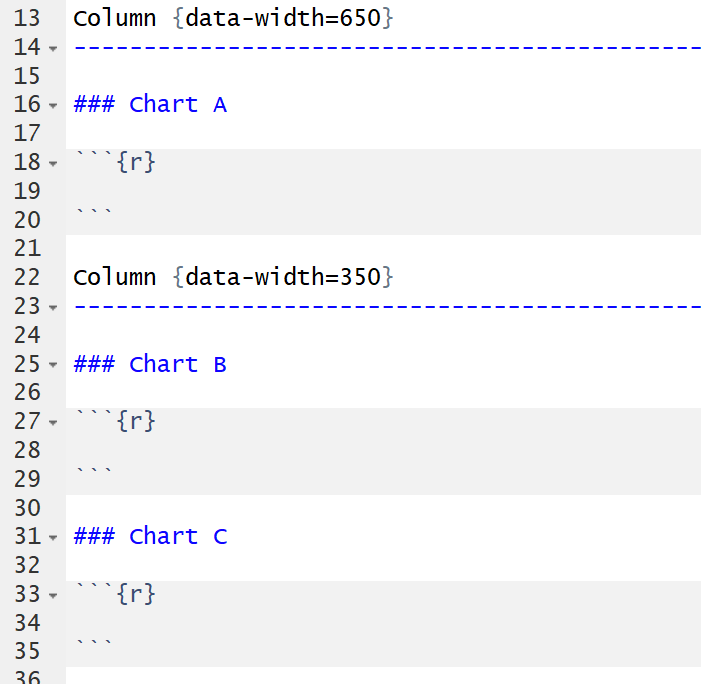
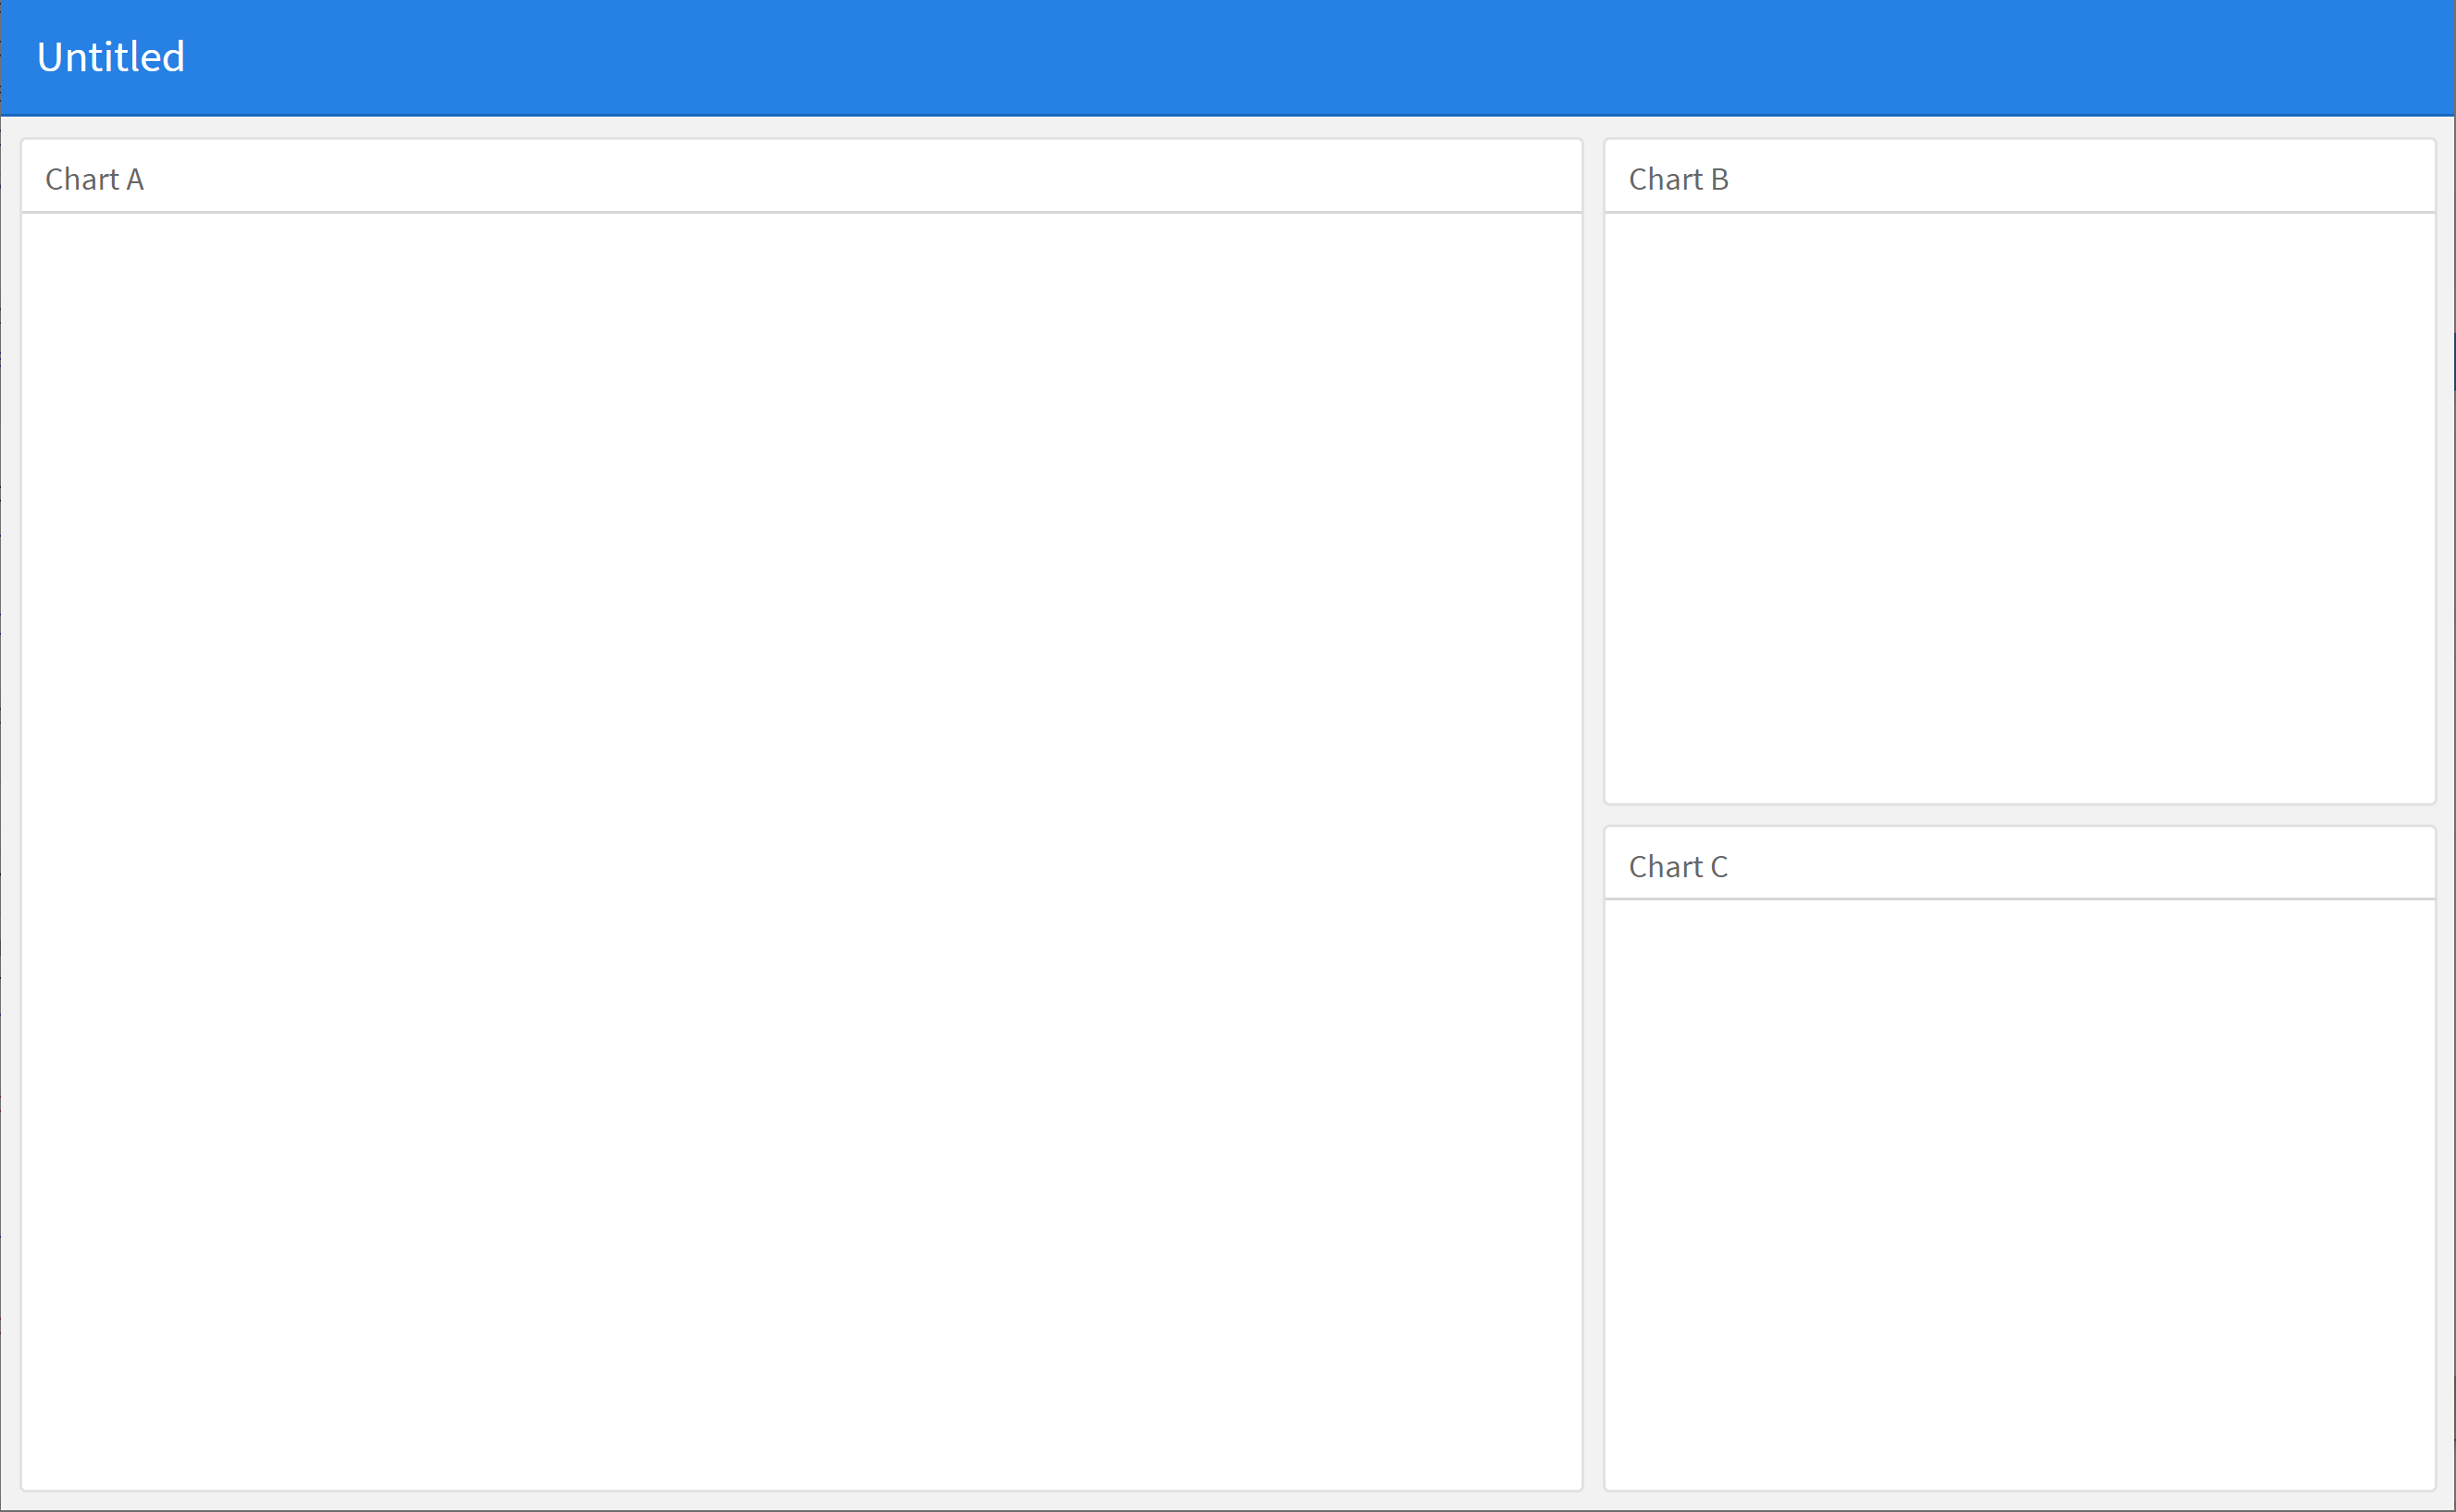
>> flexdashboard Template
layout codes
Knit it (Ctrl+Shift+K) and get ...
相信同学们现在对 shiny、shinydashboard / bs4Dash 和 flexdashboard 有了初步的认识,以下列出相关的学习参考资料,同学们可进一步学习精进下 🏆
{{
shiny官网}} 上有大量的学习资料!👍👍👍:循序渐进的 {{7 份教程}}
Welcome to Shiny
Build a user interface
Add control widgets
Display reactive output
Use R scripts and data
Use reactive expressions
Share your apps
👍👍👍:{{示例库}}